
A lot is made of regional divides. Urban vs. rural. Interior vs. coasts. North vs. South.
Yet, when I look at political data, these regional divides are rarely where the serious action is. Instead, the big political divisions involve factors such as race, religion, education, income, and gender. Once these kinds of basic demographics are taken into account, there may still be some additional differences based on living in a city or living in the South or whatever, but typically not very large ones.
This isn’t to say that regional differences are trivial. It’s just to say that most of the political differences between different U.S. places are a function of more basic demographics. And, indeed, there are enormous demographic differences between different places within the U.S.
Most people have a broad sense of some of these differences, but I wanted to take a more systematic look. So I used my large file of Pew datasets from 2013 to 2016—containing over 97,000 individuals—and had a go at it. In short, I loaded in, for each state: urban/rural proportion; the basic racial composition of its urban, suburban, and rural areas (white vs. black vs. Hispanic/Asian/other); the basic religious composition of white folks in its urban, suburban, and rural areas (not Christian vs. non-evangelical Christian vs. evangelical, which I define to include Mormons); and the percentage of white folks who have 4-year college degrees in its urban, suburban, and rural areas. I then did a cluster analysis on the states and was most happy with the one that produced five groups.
Keep in mind that, in lumping the states into coherent clusters, I didn’t tell my stats program where the states are; I just told it what sorts of folks are in those states. Nonetheless, there was a good deal of recognizable regional clustering—no surprise, it turns out that lots of neighboring states are demographically similar to one another. But there were also a couple of non-contiguous groups.
The map below shows the five clusters. You can see various southern states grouped together (shaded red), various northeastern states grouped together (shaded blue), and various western and southwestern states grouped together (shaded brown). These were easy enough to name: South, Northeast, and WXSW (that is, West by Southwest). But the other two groups are messier. These, for reasons I’ll explain below, I named Homogena (shaded white) and Contrastia (shaded green).
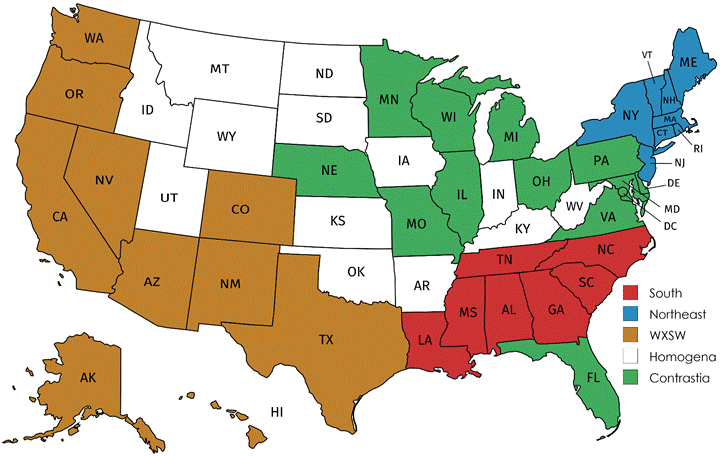
In general, the South and WXSW groups stand out for their racial diversity, the former containing relatively high numbers of blacks and the latter containing relatively high numbers of Hispanics/Asians/others. Lots of urban areas outside of these states also have high racial diversity, but these two groups have pretty high numbers of non-whites in their suburban and rural areas as well.
The stand-out feature of the Northeast group is primarily that its white population is less Christian and particularly less evangelical. In addition, its white population contains a higher percentage of college graduates. Like racial diversity, these features—having less-religious and better-educated whites—are common in lots of urban areas. But in the Northeast states this is also true of their suburban and rural populations.
The group I’ve labelled Homogena is, well, homogenous. This is a cluster that is largely white, and where whites are relatively more religious and less educated. This is true of lots of rural areas—whiter, more religious, less educated—but in these Homogena states it’s also true of their suburban and urban areas.
And, lastly, the group I’ve labelled Contrastia has a big contrast between urban and rural areas. Its urban areas look a lot like those in WXSW—racially diverse and with less-religious and better-educated whites. But its rural areas look like Homogena—lots of whites, most of whom are more religious and less educated. (Think, e.g., of the old quip about how Pennsylvania is Philadelphia in the east, Pittsburgh in the west, and Alabama in between.)
And then, of course, there are differences in the relative sizes of urban and rural populations across these state groups. Homogena is the most rural—according to Pew’s categories, there are around 1.35 rural folks for every urbanite. The South group is balanced at 1 to 1. Contrastia has almost 2 urbanites for every rural resident. And in both the Northeast and WXSW, urban dwellers far outnumber rural folks (at 3.5 to 1 and 4.7 to 1, respectively).
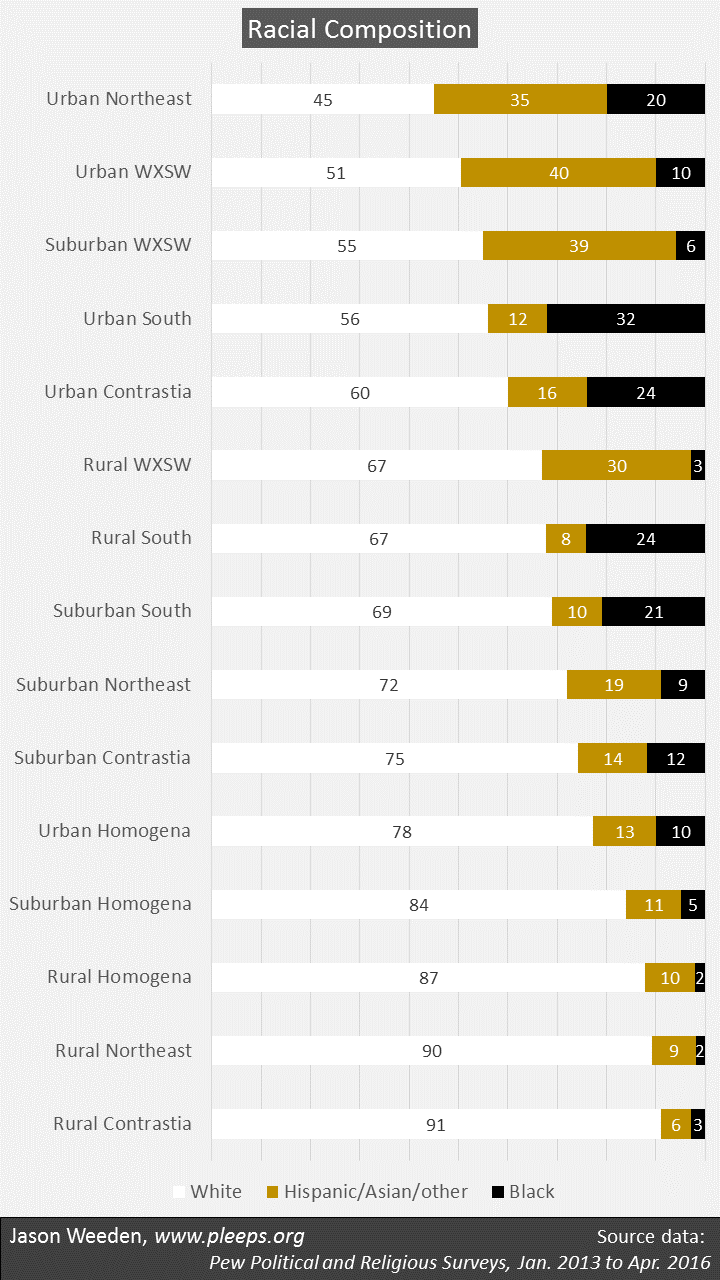
I’ll show some details. The first chart below gives racial percentages. Two big themes are apparent. First, urban areas tend to be more racially diverse than rural areas. And, second, the South and WXSW regions are more racially diverse while Homogena is particularly white—indeed, urban Homogena has a higher percentage of whites (78%) than rural South and WXSW (both at 67%).
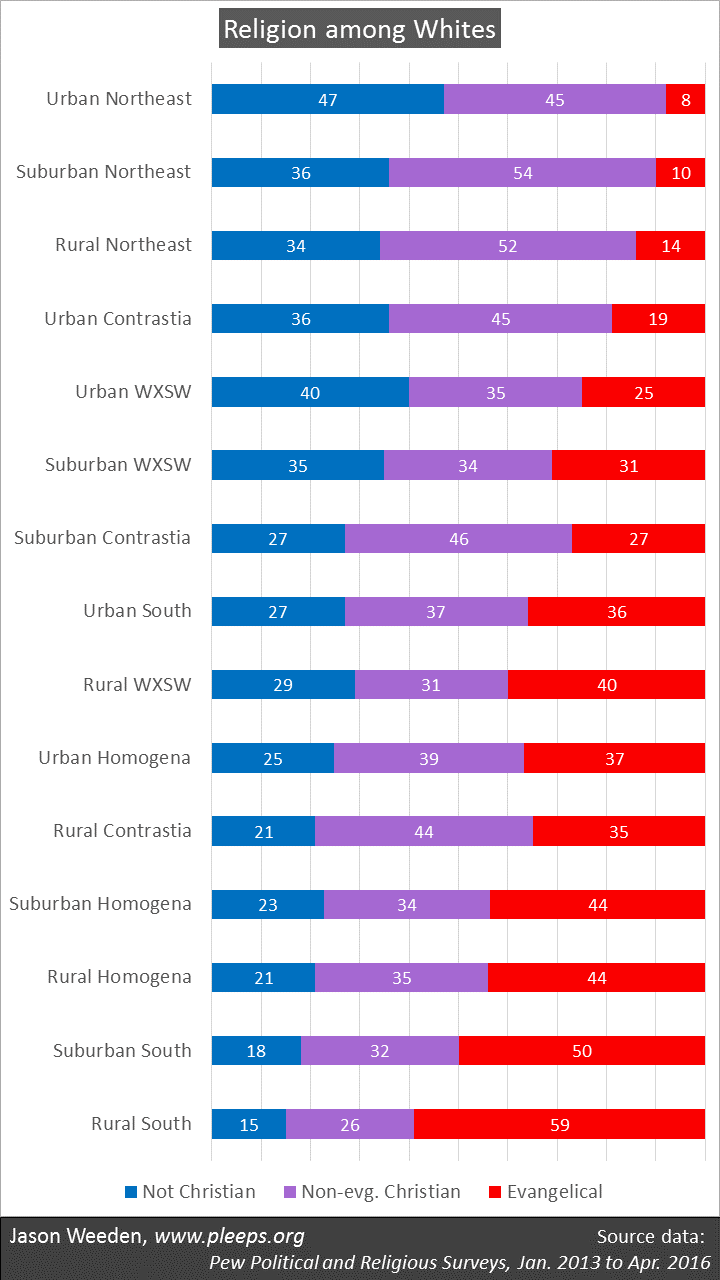
The next chart shows white religious percentages. I’m focusing here on whites because whites show by far the biggest political differences as a function of religion (see, e.g., here). The primary religious divisions among whites are non-Christians vs. non-evangelical Christians vs. evangelicals, so that’s what the chart shows. Again, there are two big trends. First, whites tend to be less Christian and less evangelical in urban areas than in rural areas. Second, whites in the Northeast group are just a lot less Christian/evangelical than whites in the South and Homogena groups—so, for example, whites in rural Northeast are substantially less Christian/evangelical than whites in urban South and urban Homogena.
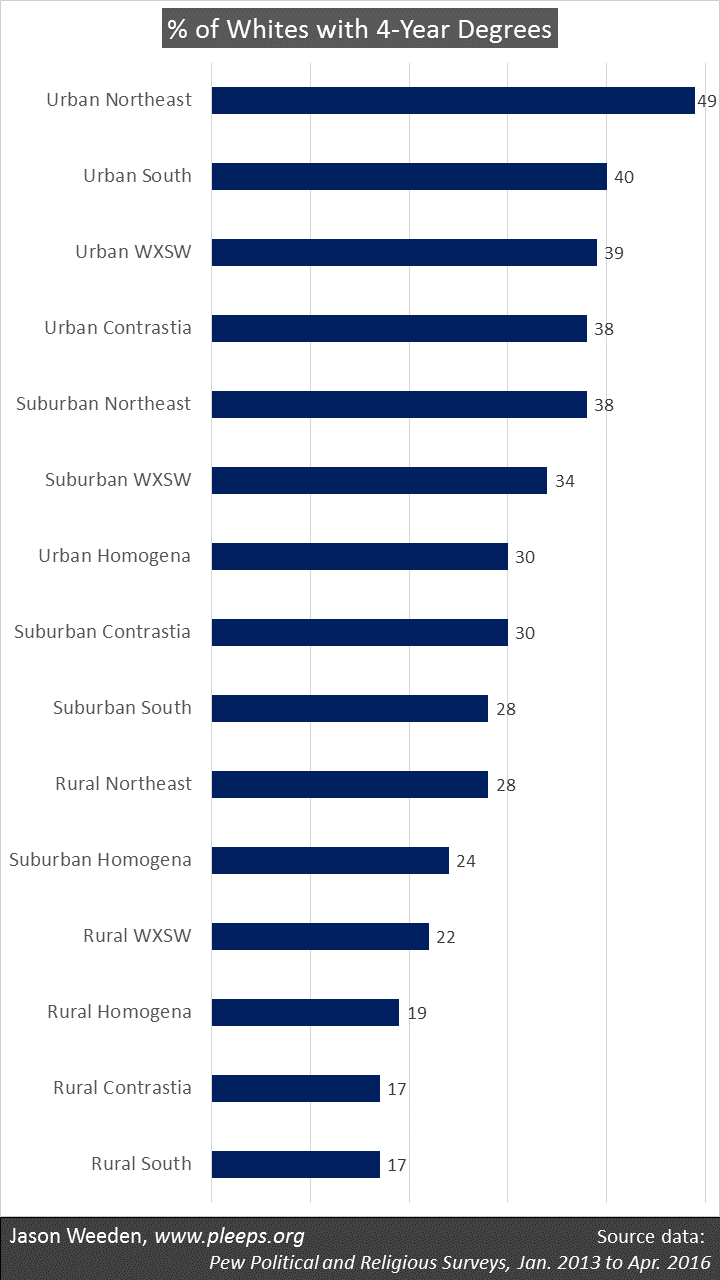
The last chart shows the percentage of whites who have 4-year college degrees. Again, I’m limiting this to whites because of education’s particular political salience for whites (e.g., the great widening of the degreed vs. non-degreed split among whites was the Big Thing in the 2016 election, showing up in both the exit polls and in stave-level shifts). And, once again, we see an urban-rural theme and a state-group theme. Urban whites are substantially more likely to have college degrees than rural whites. And then the Northeast group of states has particularly high white education levels, such that whites in the suburbs there look more like other places’ urban whites, while whites in rural Northeast look more like other places’ suburban whites.
So, you can see how the basic demographics of different places account for most of their largescale political differences these days. Democrats tend to do especially well in cities, the West Coast, and the Northeast (and these categories, as I mentioned, are themselves related, because the West Coast and the Northeast contain far more urbanites than rural folks). These are places that have various combinations of more racial minorities along with less-religious and better-educated whites. Republicans tend to do especially well in rural areas, central states, and the South (which, again, are related categories). These are places with various combinations of more whites and/or more-religious and less-educated whites. In short, for example, the political differences in party affiliation or on racial issues between white evangelicals, on the one hand, and minorities and college-educated white non-Christians, on the other hand, are very substantial pretty much everywhere you look. But the political differences within white evangelicals (or within blacks, or within college-educated white non-Christians, etc.) tend not to be all that large from place to place, though there are some differences at the margins.
All this relates to the parties’ current national consistency, something that certainly wasn’t always the case. A half century ago, there were markedly different kinds of Democrats and markedly different kinds of Republicans from region to region. But over the past few decades the parties have become thoroughly sorted and polarized on a range of issue positions. This has led to bigger splits on the basic demographics (race, religion, education, etc.) that relate to these issue opinions, and thus to regional differences driven primarily by these demographics.