[Update (April 2017): Now that data from the 2016 American National Election Studies have been released, it seems likely that my conclusions in this post are wrong. You can find the details in my new post.]
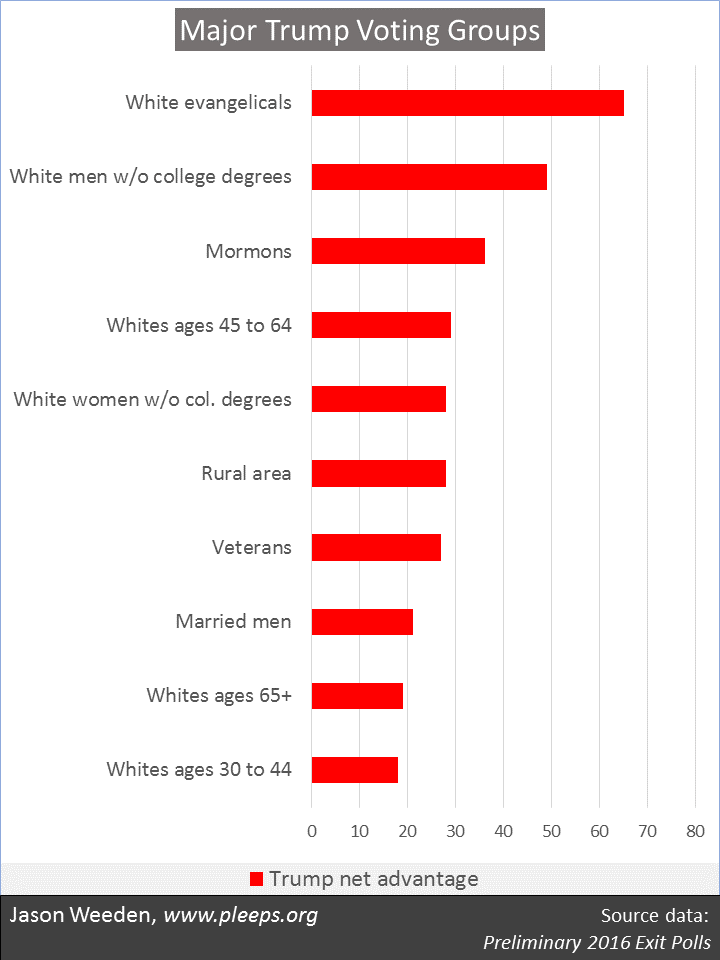
The big story of the 2016 presidential election is that Trump appears to have won an unprecedented share of whites without college degrees, especially men. According to the exit polls, Trump had a 49 point advantage over Clinton among non-degreed white men, compared with a 31 point advantage for Romney in 2012 and a 20 point advantage for McCain in 2008. Trump also performed relatively well with non-degreed white women. McCain won them by 17 points, Romney by 20, and Trump by 28. (These shifts relate to Trump’s white nationalist priorities, something that appealed to the self-interest of less-educated whites.)
Pre-election polls had suggested a smaller Trumpward shift among non-degreed whites that would be more than offset by a large Democratic shift among degreed whites. In fact, it turned out that pre-election polls had badly overestimated Clinton’s performance with white voters across the board. Non-degreed whites shifted to Trump (bigly), while whites with college degrees ended up pretty close to where they were in 2008—Trump had a 15 point advantage with degreed white men while Clinton had a 6 point advantage with degreed white women, margins very similar to the McCain/Obama race (though better for Democrats than the Romney/Obama race). Further, there doesn’t appear to have been a non-white shift to overcome Trump’s gains with non-degreed whites. While non-whites seem, in line with expectations, to have been a greater share of the electorate this time around, the exit polls suggest that their preference for Clinton (by 53 points) didn’t match their previous preference for Obama (by just over 60 points).
Thus, it appears, Trump’s success with less-educated whites (and the absence any major offsetting movement from other groups) was the demographic key, particularly helping him in Rust Belt states and rural areas.
For those who are disappointed by this result, it might be tempting to start considering libertarian epistocracy proposals. Epistocracy means, literally, having the knowledgeable (epist) run things (ocracy). The basic idea is that, one way or another, the votes of those who know the most ought to count the most.
The clearest recent statements on epistocracy have come from philosopher Jason Brennan (with related suggestions from economist Bryan Caplan, e.g., here and in his earlier book, discussed critically here). In a recent essay, Brennan explains: “Epistocracy comes in many forms. An epistocracy might give everyone one vote, then grant extra votes to citizens who pass a test of basic political knowledge (such as the citizenship exam). Or it might grant the right to vote only to citizens who pass such a test. Or it might instead hold an ‘enfranchisement lottery’: Immediately before an election, choose 10,000 citizens at random, and then those citizens, and only those, are permitted to vote, but only if they first complete a competence-building exercise. Or, an epistocracy might govern through what I call a ‘simulated oracle’ [i.e., a complex statistical procedure that would attempt to translate low-knowledge voting into high-knowledge preferences].”
How might such proposals have affected the 2016 presidential election?
Clinton/Trump under some epistocratic alternatives
Below I provide estimates of the popular vote margin and demographic representation of the electorate under a few epistocratic scenarios—scenarios where voting power is adjusted in various ways using a political-knowledge test. I don’t know of any publicly available data that shows political knowledge in relation to 2016 voting, so I used the 2012 American National Election Studies (ANES) to gauge political knowledge, and then used that information to adjust the 2016 exit poll results. The 2012 ANES included 11 political knowledge items of the sort Brennan and Caplan discuss, including things such as knowing basic economic facts, knowing the party controlling the House and Senate, and recognizing major political figures. I used the results to create demographic-and-party-specific estimates of voters’ political-knowledge test performance (e.g., I looked at how white women with degrees who identify as Democrats perform, how white women with degrees who identify as Republicans perform, how white men without degrees who identify as Democrats perform, and so on).
The epistocratic scenarios that I modeled involve either penalizing especially low-knowledge voters (i.e., those who got fewer than 5 items correct on the 11-item test) or rewarding especially high-knowledge voters (i.e., those who got 9 or more correct). I also tried a graduated scenario in which those with fewer than 5 correct responses got 1 vote, those with 5 or 6 correct responses got 2 votes, those with 7 or 8 got 3 votes, and those with 9 or more got 4 votes.
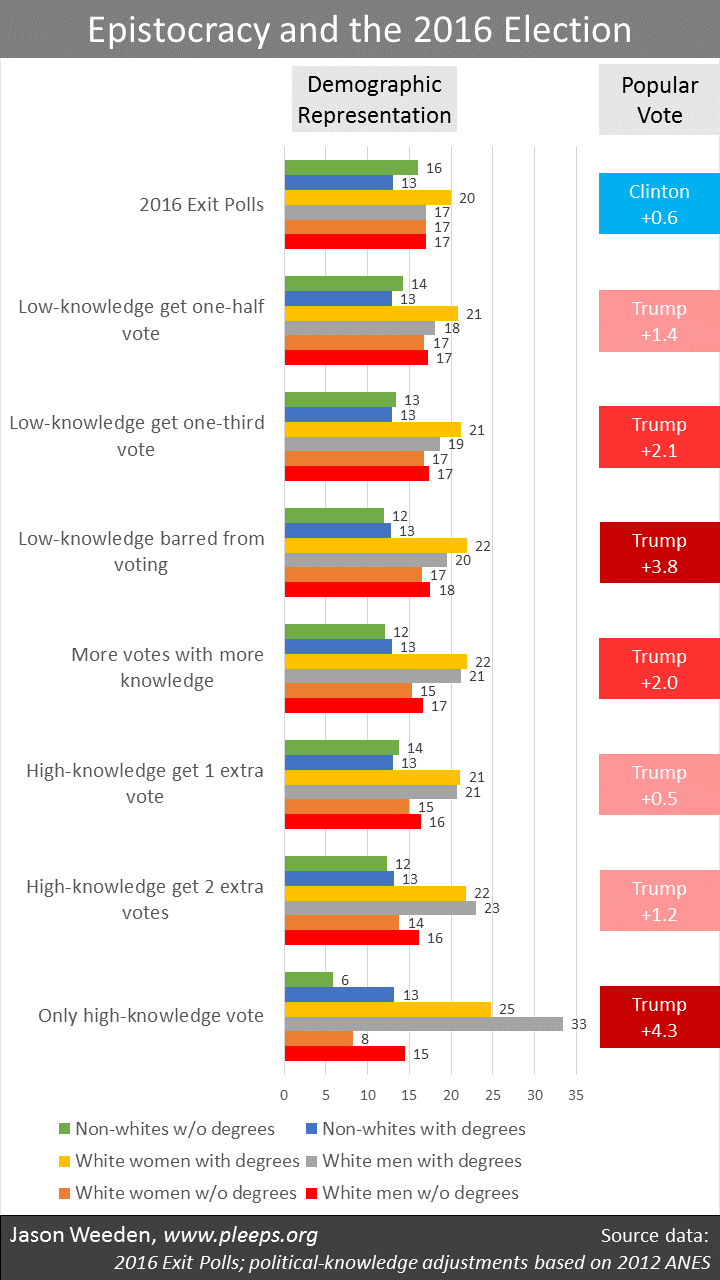
The chart below shows the results. The first outcome is simply the 2016 exit polls without any adjustment. While exit polls often get a bad rap, and probably do badly miss some specific groups either in terms of turnout or voting preferences, this year they ended up giving a fairly accurate read of the actual popular vote margin as a whole, showing Clinton with a small advantage over Trump. In fact, the best information on actual votes at the time I’m writing this is that Clinton has 47.7% of the popular vote compared with Trump’s 47.1%—a 0.6 point advantage for Clinton—which is almost exactly what the exit polls showed. The actual vote totals will likely further shift in Clinton’s direction as some still-uncounted votes become counted (including, e.g., some West Coast absentee ballots), but won’t shift by all that much at this point.
Next on the chart are the various epistocratic scenarios. What if we give especially low-knowledge voters only half a vote, or only a third, or bar them completely? What if we use a graduated more-votes-for-more-knowledge system? What if we give especially high-knowledge voters an extra vote, or two, or take epistocracy literally and allow only these high-knowledge folks to vote?
Do any of these proposals improve Clinton’s popular vote margin over Trump? No. In fact, each one would have given Trump a popular vote lead, anywhere from 0.5 points (giving high-knowledge folks a single extra vote) to 4.3 points (letting only high-knowledge folks vote). In an epistocracy of the sort Brennan and others imagine, Trump’s victory over Clinton would have been even more securely won.
Well that’s (actually not) surprising
I know that many of my high-education compadres will think these results are madness. Surely, many believe, the smartest people are mostly Democrats. But it’s really complicated.
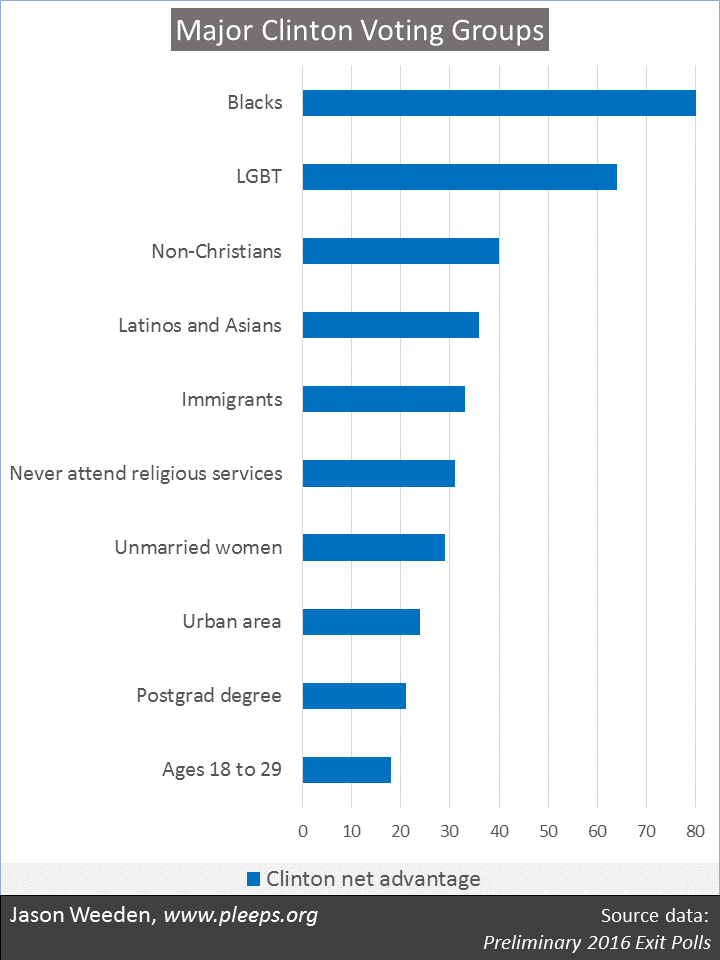
The Democratic coalition actually combines many who have the highest average political knowledge (e.g., Ivy Leaguers and folks with postgraduate degrees) with many who have the lowest average political knowledge (e.g., non-whites without college degrees). And, moreover, the most solid Democratic support often comes from the low-performing part of the coalition—so, for example, the exit polls show Clinton winning voters (of all races) with postgraduate degrees by 21 points, but this is dwarfed by her 55 point win with non-degreed non-whites. The reality is that anything that lowers the voting impact of less-educated non-whites is particularly detrimental to Democratic margins—including various well-known current Republican efforts (voter ID requirements, voter purges, felon bans, reducing the number of polling locations in minority neighborhoods, gerrymandering to further concentrate minority votes, and so on) and also including many libertarian epistocracy proposals.
Also, the role of political knowledge can vary from group to group. So, for example, within college-educated whites, higher political knowledge is associated with less Republican support. But within non-college whites, higher political knowledge predicts more Republican support. Among non-whites, voters with high political knowledge support Democrats by lower margins than voters with low political knowledge. Again, it’s really complicated.
Further, political knowledge—as measured by the standard kinds of questions—relates strongly to education, but is also substantially higher among older folks, whites, and men. So, for example, while the exit polls show somewhat more white women than white men turning out to vote (the top outcome on the chart), a scenario in which only high-knowledge folks vote (the bottom outcome on the chart) would be one in which men constitute almost 6 in 10 white voters. Given that white men were well more likely to vote for Trump than white women, this kind of epistocratic gender skew would be a real contributor to increasing Trump’s popular vote margin. (As a reminder, the exit polls had Trump winning degreed white men—the key beneficiaries of epistocracy—by 15 points, 54 to 39.)
The reality of epistocracy
No, epistocracy would not have prevented Trump from defeating Clinton. In fact, primarily by making the vote whiter and more male, it would have given him the popular vote to go with his Electoral College victory. (Having said that, it’s certainly possible that some epistocratic proposals could have prevented Trump’s Republican nomination in the first place. I’ll leave that analysis to others.)
Keep in mind that we already live in a kind of epistocracy. First, political knowledge is strongly associated with the propensity to vote. So, in the 2012 ANES sample, only 59% reported voting among those getting fewer than 5 of the 11 political knowledge questions correct, rising to 76% of those answering 5 or 6 correctly, 88% of those answering 7 or 8 correctly, and 93% of those answering 9 or more correctly. In addition, our governmental decision-makers (including elected representatives, cabinet members, high-level bureaucrats, judges, and so on) have, on average, very high levels of political knowledge. And they have rather oversized numbers from demographics associated with high-knowledge voters—college-educated, older, white, and male.
These sorts of patterns already result in a number of policy realities that are more libertarian-leaning than the general public would prefer (including lower taxes on the wealthy and stingier spending, but also fewer restrictions on abortion, more immigration, and more vigilance against group-based discrimination). But I understand why solid libertarians don’t think this goes far enough and would prefer some form of intervention to further increase the influence of libertarian demographics. Just as I understand why solid liberals who understand the effects of epistocracy proposals will oppose them. Most people have results-oriented political minds, after all.

