
I previously looked how demographics—race, religion, gender, and so on—relate to whether people are more liberal or more conservative on Pew’s ideology scale, which combines ten different issue items (on government spending, environmental regulation, race, immigration, homosexuality, and so on) into a single measure. Today, I’ll do the same thing with data from the recently released 2016 Cooperative Congressional Election Study (CCES).
The best thing about the CCES is that it’s yuge. The Pew data in my prior post included around 16,000 survey-takers, which is pretty damn good, but this CCES sample is over 64,000. (According to dictionary.com, this is pronounced: siks-tee fohr muhth-er fuhk-ing thou-zuhnd.)
The pre-election wave of the CCES included a number of questions about policy preferences. I chose a set of ten of these to make my CCES ideology scale—including items on assault rifles, conceal-carry permits, border patrols, deportation, abortion rights, abortion funding, environmental regulations, same-sex marriage, government spending priorities, and the minimum wage (I include the full items at the bottom of this post). Most of the CCES issue questions were in a binary support/oppose format, which made the ideology scale straightforward: For each of the ten policy items, I coded the liberal option as 1 and the conservative option as 0, and then added them all up. Thus, an extreme liberal would score 10 (by giving the liberal response on all ten survey items) and an extreme conservative would score 0.
The CCES has a nice range of demographic information, including race, religion, church attendance, age, gender, education, income, marital status, employment status, sexual orientation, transgender status, whether the respondents have been union members, whether they’ve served in the military, whether they own their home, whether they invest in the stock market, and whether they or their parents are immigrants.
In short, I took the 10-point issue-based ideology scale and started looking for demographic splits. The biggest deals were sexual orientation and religion, so I first split up the sample by the major divisions there. Then I went into the largest of the remaining subgroups and looked for whatever the next-biggest deals were, and created even smaller subgroups, and so on. I stopped when I had 24 subgroups. These 24 groups are mutually exclusive and encompass the entire sample.
And that’s what’s shown on the two charts below. They contain each group’s average score on the 10-point issue-based ideology scale. In the first chart, I show the most liberal six groups and the most conservative six groups. So, the first line is “LGBT; Atheist/agnostic”—these are people who both (1) indicated that they are either lesbian, gay, bisexual, or transgender and (2) chose either atheist or agnostic as their religious category. And it’s just a really liberal group. When asked the ten different issue questions, they chose the liberal responses on 8.5 items on average. In fact, almost two-thirds of these folks are mega-liberals (scoring 9 or 10) while less than 1% are mega-conservatives (scoring 0 or 1). The most conservative group is at the bottom of the chart—straight (i.e., not LGBT), evangelical, white, male homeowners. They average around 2.6, where over 40% are mega-conservatives while less than 3% are mega-liberals.
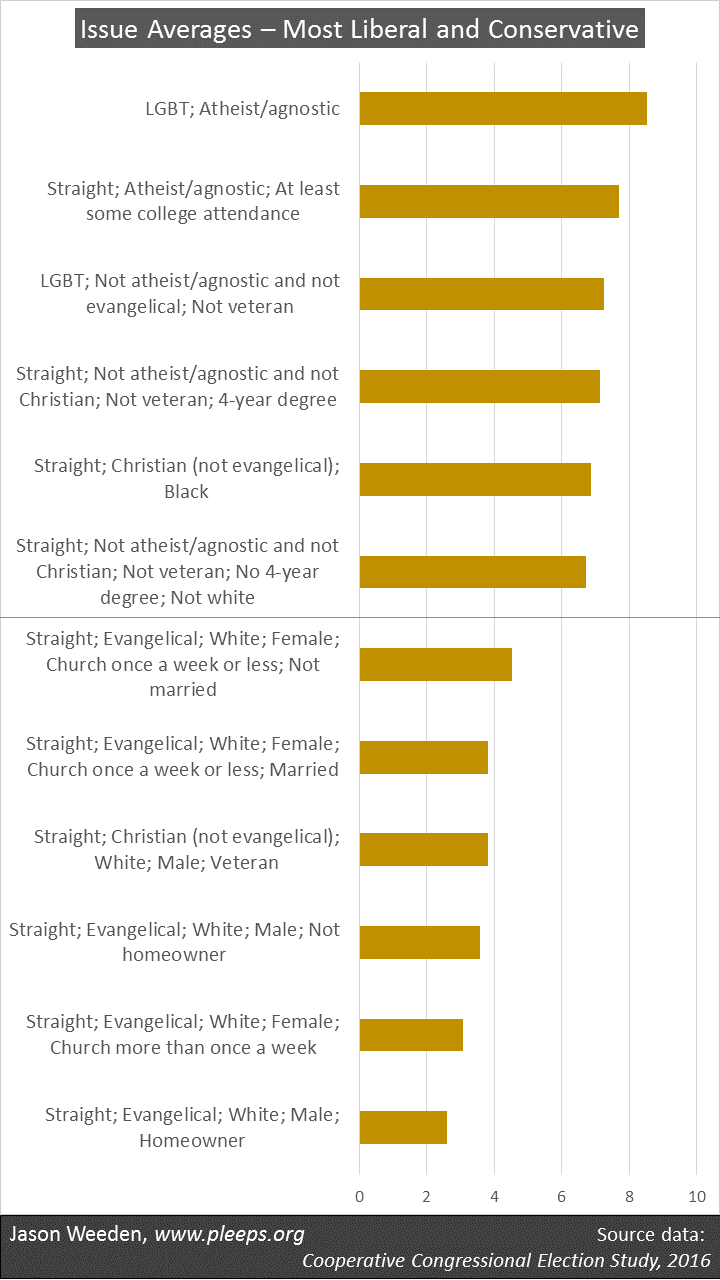
Overall, on the first chart above, the most liberal groups are a sort of demographic rebel alliance, including many LGBT folks, atheists/agnostics, other non-Christians (Jews, Buddhists, “nothing in particular,” and so on), and racial minorities. (Keep in mind, though, that we’ve got a second chart coming, which will show some not-so-liberal LGBT folks, non-Christians, and racial minorities. For example, LGBT folks who are also either evangelicals or military veterans are actually middle-of-the-road on average.)
The most conservative groups, in contrast, are almost all anchored by straight, evangelical whites. In fact, I ended up with five groups made up of straight, evangelical whites, and they’re all among the six most conservative groups. The other group showing up here includes straight, white, non-evangelical Christians who are male military veterans.
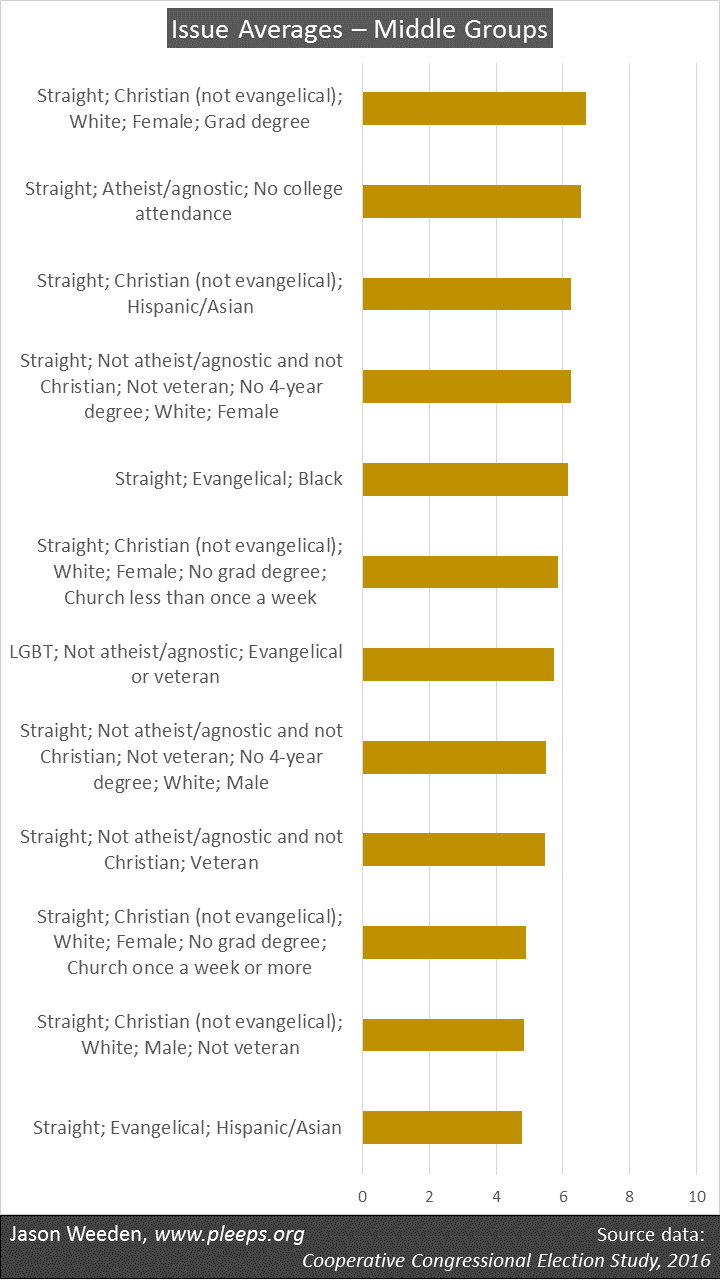
The second chart below shows the 12 groups in the middle. As I mentioned, some of the more interesting ones here involve groups you’d normally think of as pretty liberal—LGBT folks, non-Christians, and racial minorities—that actually aren’t so liberal among some narrower segments. These include: straight atheists and agnostics who’ve never attended college; other straight non-Christians who don’t have 4-year degrees or who are military veterans; straight, Christian Hispanics and Asians; straight, evangelical blacks; and, as already mentioned, LGBT folks who are either evangelicals or veterans.
Another way to frame what’s going on here is to think about the averages on the 10-point issue-based ideology scale as simultaneously influenced by a wide range of characteristics. Some demographic features push the average up in a more liberal direction (being LGBT, atheist/agnostic, black, etc.) and other features push the average down in a more conservative direction (being evangelical, white, a veteran, etc.).
In fact, here’s some actual math allowing you to estimate the average ideological positions of a wide range of very specific profiles:
- Think of a group defined simultaneously by LGBT status (yes/no), religion (atheists and agnostics vs. other non-Christians vs. non-evangelical Christians vs. evangelicals), whether they attend religious services more than once a week (yes/no), race (white/black/other), veteran (yes/no), whether they have PhDs, MDs, MBAs, or other graduate degrees (yes/no), and gender (female/male).
- Start with 6.4.
- Then, if applicable to the group you’re thinking about, add 1.3 for LGBT folks, 1.3 for atheists/agnostics, 0.9 for blacks, 0.7 for folks with graduate degrees, and 0.7 for women.
- Then, if applicable to the group you’re thinking about, subtract 2.1 for evangelicals, 0.8 for whites, 0.8 for folks who go to religious services more than once a week, 0.7 for veterans, and 0.7 for non-evangelical Christians.
The result gets you very close to that group’s average on the 10-point ideology scale. A quick example. People similar to Barack Obama: start with 6.4, add 0.9 (black), add 0.7 (grad degree), and subtract 0.7 (non-evangelical Christian). The result is 7.3, a rather liberal average.
From these numbers, you can see where the big-deal divisions are. Atheists/agnostics (+1.3) and evangelicals (-2.1) are, thus, on average, 3.4 units away from each other. Blacks (+0.9) and whites (-0.8) are, on average, 1.7 units apart. LGBT folks are, on average, 1.3 units more liberal than straight folks. As shown in the charts above, these can really add up when people contain multiple features pointing in the same direction (e.g., people who are both LGBT and atheist/agnostic), but can also create politically conflicted groups when some major feature pushes one way and another pushes the opposite way (e.g., people who are both evangelical and black).
Unpacking ideology
On the issue-based ideology scale I’m using here, fewer than 30% of the CCES sample are mega-liberals (with scores of 9 or 10) or mega-conservatives (with scores of 0 or 1). The other 70% have at least a couple of liberal views and a couple of conservative views among their ten issue positions. In fact, almost a third of the sample have more-or-less equal numbers of liberal and conservative issue opinions, landing in the middle range from 4 to 6.
Ideological consistency is a big and growing deal, but there remain interesting domain-specific factors creating ideological divergence. I’ve showed some of that in various posts I’ve done (mostly using Pew data) on the demographics of specific issues—for example, racial discrimination, marijuana legalization, income redistribution, and views on immigration and Islam—and especially when I directly contrasted white nationalist vs. economic issues, white nationalist vs. lifestyle issues, and economic vs. lifestyle issues.
And then Kurzban and I have a book that systematically goes through the varying demographic differences driving a wide range of political issues, mostly using data from the General Social Survey (GSS). There, we also spent a lot of time trying to figure out why there are all these domain-specific demographic patterns, and we primarily chalked it up to interests. Really, though, lots of the major pieces of political analysis are hard to tease apart—there’s a big overlap among interests, identities, demographics, ideology, partisanship, and issue positions.
I might do some issue-specific analyses of the CCES data in future posts. But online panels like the CCES are probably better for large-scale ideological patterns than for specific issues. Ideological clustering tends to be significantly stronger in online samples (and then it’s a bit less strong in phone samples like Pew, and then weaker still in knock-on-doors samples like the GSS), so the CCES probably overstates the similarity of demographic predictors across different kinds of issues. But, still, I might give it a shot. It’s just a blog after all.
Notes for nerds: Variables and terminology
I used CCES’s “commonweight” weighting variable for all analyses.
Here are the ten policy items from the CCES that make up my ideology scale: Ban assault rifles (support=1 and oppose=0); Make it easier for people to obtain concealed-carry permit (oppose=1 and support=0); Increase the number of border patrols on the U.S.-Mexico border (not selected=1 and selected=0); Identify and deport illegal immigrants (not selected=1 and selected=0); Always allow a woman to obtain an abortion as a matter of choice (support=1 and oppose=0); Prohibit the expenditure of funds authorized or appropriated by federal law for any abortion (oppose=1 and support=0); Strengthen enforcement of the Clean Air Act and Clean Water Act even if it costs US jobs (support=1 and oppose=0); Allowing gays and lesbians to marry legally (favor=1 and oppose=0); Raise taxes and cut defense rather than cut domestic spending (favor=1 and oppose=0); Raise the federal minimum wage to $12 an hour by 2020 (for=1 and against=0).
To arrive at the issue set, I used stepwise regression involving a number of CCES policy items to predict self-labelled ideology, party identification, and the two-party 2016 presidential vote. I selected the ten items that made the biggest contributions to these regressions. That is, I wanted a set of items, each of which contributed in its own way to predicting broad political orientations and voting.
Some terminology: “White” includes non-Hispanics who were coded as either white, native, or other. “Hispanic/Asian” includes Hispanics (regardless of other racial category), Asians, Middle Easterners, as well as mixed-race individuals. “Evangelical” includes all non-Catholics who identified as “born again or evangelical” as well as Mormons.