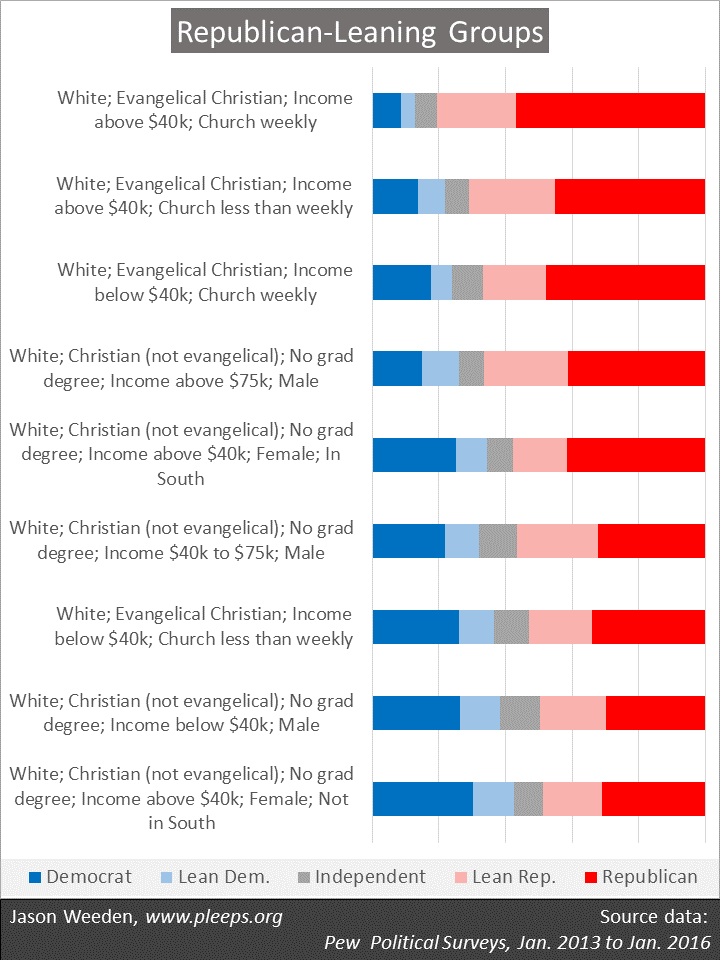
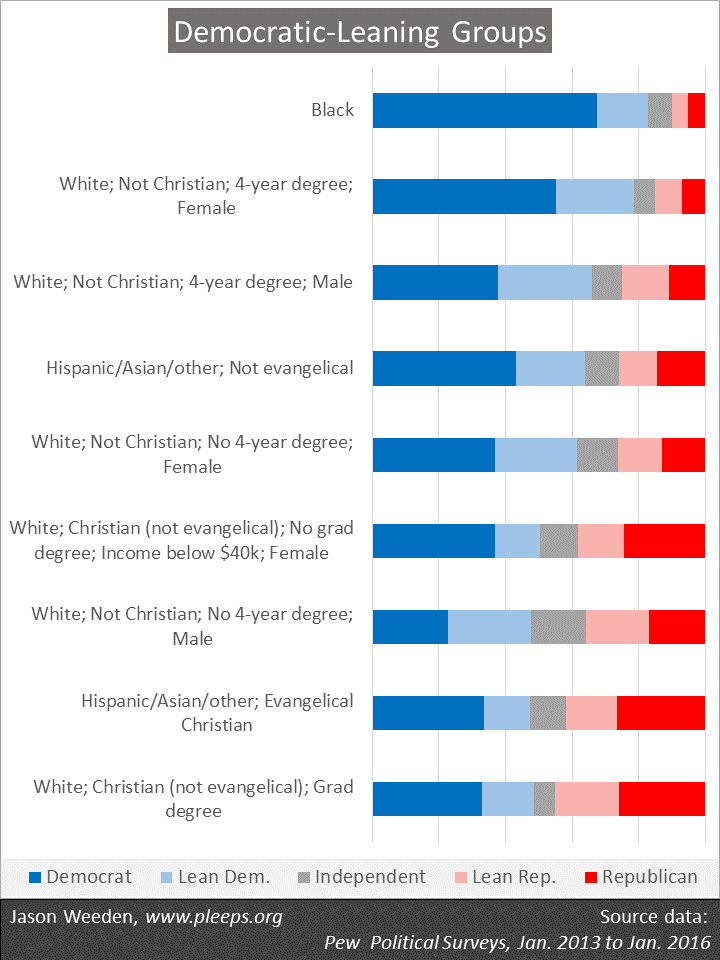
There’s talk about how voters seem to be “coming home” at this stage in the 2016 presidential race, with both candidates solidifying support from their party identifiers. This post is a reminder of who these Republican and Democratic identifiers are. Using Pew political surveys of people registered to vote from the period between the 2012 election and the 2016 primaries (N = 48,160), here’s the basic demographic breakdown of the pre-2016 party coalitions.
Republican-leaning groups (shown in the chart below) are dominated by white Christians, especially those who are self-identified evangelicals, have higher incomes, attend church regularly, don’t have graduate degrees, and are male.
 (Note: “Evangelical” includes non-Catholic Christians who self-identify as “born again or evangelical” and Mormons.)
The Democratic coalition, in contrast, primarily includes racial minorities and non-Christians (and also non-heterosexuals, information not usually available in Pew data, but something that shows up clearly when it is), especially women and those with more education. Also skewing Democratic are non-evangelical Christian women with low incomes and non-evangelical Christians with graduate degrees.
Some often-discussed demographic items don’t show up as major points of division. Age, for example, isn’t a very big deal in party identification once you’ve taken into account that younger voters are more likely to be racial minorities and less likely to be Christians. Similarly, the urban/rural and coastal/southern divides are in large part a function of their residents’ contrasting racial and religious profiles.
A deeper dive into partisan demographics requires keeping in mind how bits of information overlap. Some examples: Minorities tend to be poorer and less educated than whites. People with more education and married people tend to be richer. Single women tend to be poorer than single men. Evangelicals tend to be less educated and to go to church more. Blacks are more likely to be evangelicals and less likely to be married. When Hispanics and Asians are Protestants, they’re less likely to be immigrants. And so on. It’s complicated stuff.
One of the overarching patterns that’s often confusing involves socioeconomic status. In short, especially among whites, people with higher incomes skew to the right while people with higher education skew to the left. The trick is that the two patterns are driven by different kinds of issues. Those with higher incomes tend to be more conservative specifically on redistributive economic issues. Those with higher education tend to be more liberal primarily on issues of discrimination as well as on abortion.
Another common source of confusion is the “what’s the matter with Kansas” thing, claiming that downscale whites ignore their economic interests. It’s a story that’s just not true. The fact is that white Christians with lower incomes have long been less likely to support Republicans than those with higher incomes. If you’re looking for people who tend to ignore their incomes when voting these days, you should be looking at core Democratic groups, particularly at blacks and degreed non-Christians. A deeper problem with the Kansas frame is that it equates one piece of the self-interest pie—policies involving income redistribution—with the whole pie. People also have self-interest in issues of discrimination and meritocracy (and, indeed, the Democratic coalition seems to be primarily driven by these interests) as well as with sexual and reproductive lifestyle issues like abortion. Sometimes one set of issues tends to dominate a group’s partisan leanings (e.g., issues of race for black voters) and sometimes groups are best understood as essentially averaging across their issue interests (e.g., white Christians).
What’s changing this year?
The details of party coalitions are always evolving. For example, the strong Democratic advantage among the most-educated folks is a pretty recent development, having become a big deal only since around 2004. In a related vein, the pre-election polls this year suggest that Clinton might perform substantially better with college-educated whites than Obama did.
In general, we could see new patterns in this election from at least four sources: (1) Cohort replacement, as older, whiter, more religious, less educated generations are being replaced by more diverse youngsters. (2) Some groups might be relatively more likely to have changed their party identifications in response to the current race. (3) Some groups might be relatively more likely to not vote in line with their party identifications in the current race. And (4) some groups might be relatively more likely or unlikely to turn out to vote this time around. With college-educated whites, for example, some of Clinton’s increased margin in pre-election polls could be from cohort replacement (e.g., the younger folks are less religious), some from party-switching, some from outside-their-usual-party voting, and some from changes in turnout intentions (affecting their inclusion in reports on “likely voters”).
In fact, any changes this year in the demographics of party identification are likely to be subtle, requiring lots of data and time to determine definitively whether any apparent shifts are real. As for the outcome of the current election, its main determinant will likely be—as usual—varying turnout among demographic groups whose preferences were largely predictable months (and even years) ago.

