Over the past century, typically around 57% of the voting-eligible population votes in presidential elections, while it’s around 41% in midterm elections. Most recently, the 2012 presidential election was about average and turnout in the 2014 midterm was on the low side at about 36%.
As we head into the current presidential election, here I look at Pew’s registration variable, which asks respondents their level of confidence that they’re currently registered to vote. The sample is of the entire U.S. adult resident population, and so includes people both eligible and not eligible to vote. The main reason resident adults wouldn’t be eligible is because they’re not citizens (since 1996, non-citizens have been banned from voting in federal elections). Another key reason is that many states ban people with felony convictions from voting, something that currently prevents about 5.8 million citizens from voting, including about 1 in every 13 black citizens and about 1 in every 56 white citizens.
When we look at stats on population-wide voter registration, there are two broad sets of reasons why people are not registered—either they can’t or they haven’t. In addition, Pew’s registration item is a self-reported one, and so involves the further issue that some folks might be registered and not know it, while others might think they’re registered but aren’t. Overall, though, one should expect this sort of variable to correspond pretty well to the relevant facts—to respondents’ eligibility and recent history with registering and actually voting. The exact numbers will be off, but the general trends will be on point.
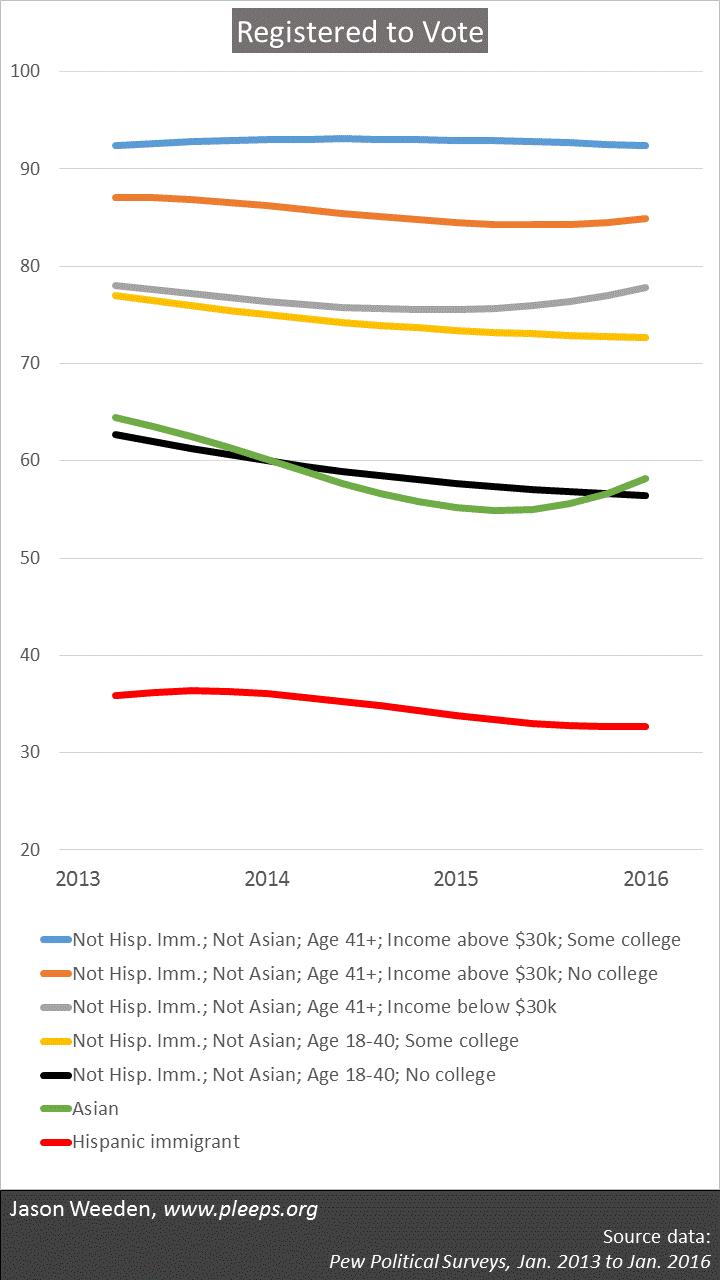
The chart below gives the larger demographic breakdowns in the Pew registration item. Mainly, groups where one would expect lower proportions of citizens are especially less likely to report being registered, including Hispanic immigrants and Asians (Pew typically asks only Hispanics if they’re immigrants). Beyond that, the big trends are age (younger people are less likely to be registered), education (people who haven’t been to college are less likely to be registered), and income (poorer people are less likely to be registered). I’ve plotted the trend lines within each group from the beginning of 2013 to the beginning of 2016 (the latest publicly available Pew data).
 (The total sample size is 58,551.)
The differences between groups are quite large. The highest groups include folks who are not Hispanic immigrants, and not Asian, and ages 41 and over. Among these folks, the average confidence in being registered is around 93% for those with incomes above $30,000 and who have been to college, while for those with incomes below $30,000 it’s only around 76%. Drop down to those ages 18 to 40, and it’s around 74% for those who have been to college and only around 59% for those who haven’t. Asians look roughly similar to this latter group, while Hispanic immigrants averaged only around 35% over this survey period (no doubt related to the fact that, in addition to being less educated and poorer on average, many are not citizens).
This sample picks up these groups just a couple of months after the 2012 election (where turnout was around 57% or 58%), continues through the 2014 midterms (where turnout dropped to only around 36%), and ends just before the earliest 2016 nominating contests. One shouldn’t put too much stock in the exact trend-lines, but they do suggest various interesting patterns. Mainly, the lines for younger residents continually slope downward over the survey period, suggesting both a reduced interest in the 2014 midterms as well as a relative lack of overall interest prior to the start of the 2016 nominating contests. In addition, some groups started trending up in 2015, including older folks who are poorer and less educated as well as Asians (though take the Asian line with an additional grain of salt, because it comes from the smallest sub-sample).
With registration, what I’ll be looking for in future Pew releases will be how the trend-lines continue to evolve, and particularly what they might suggest about whether the current presidential election is drawing in higher-than-usual numbers from certain groups. One might expect, for example, that an election centering on immigration might draw relatively more Hispanics, Asians, and working class whites. The current trend-lines do contain hints of this, perhaps, but it’s just too early to tell (from the publicly released data, anyway) whether we should be expecting major new patterns in turnout this time around.
