The horror of anecdotes

Kari Baker was a beautiful mother of two young daughters. And now she’s dead. She was, according to a Texas jury, murdered by her husband, Matt Baker, who allegedly slipped his wife a lethal overdose of ground-up sleeping pills so that he could be with his mistress. An important thing to know about Matt Baker is the he was a white pastor at a Baptist church.

Janet Tillman was also a beautiful mother of two daughters. And now she’s dead as well. She was, according to an Alabama jury, murdered by her husband, Timothy Dane Tillman. Allegedly, Mr. Tillman had recently proposed to his mistress in Mississippi, and he shot Janet in the back, trying to pass it off as a tragic accident. At the time of the killing, Timothy Tillman was a white pastor at an Assembly of God congregation.

Frank Craig was an 85-year-old man who had donated a substantial sum to fund an agricultural museum to be built behind the Hickman Community Church. And now he’s dead. He was, according to a California jury, murdered by the pastor at Hickman, Howard Douglas Porter, who allegedly had been using Mr. Craig’s substantial donations not for a museum but instead to pay for a new house for the murdering Porter, and who killed Craig to make sure the fraud never came to light. The Rev. Howard Porter was not just a pastor—he was a white pastor.

The murderous menace of white pastors?

So far as I know, each of the stories I just told is absolutely true. My accounts are based transparently on the linked media reports, which I have no reason to suspect are erroneous or misleading.

So what are we to make of these stories? Are white pastors especially dangerous monsters? Are their ranks filled with adulterous thieves, blithely murdering the innocent wives and elderly benefactors that get in the way of their sociopathic schemes?

Of course not. Of. Course. Not. Look, I’ve never seen data that’s directly on point, but I’d be willing to bet real money that white pastors are in fact, on the whole, an unusually law-abiding lot.

Yet there are always anecdotes. Give any sizable group of human beings—and particularly any sizeable group of men—enough time and it will produce a number of spectacular horrors. Even among white pastors.

The murderous menace of immigrants?

In his speech tonight, as he did throughout his campaign, apparently Trump will unleash a similar barrage of anecdotes, not about white pastors, but about undocumented immigrants. According to a news report, “President Donald Trump and first lady Melania Trump will invite three relatives of victims of deadly crimes committed by undocumented immigrants to the president’s joint address before Congress on Tuesday.”

But while I’m just guessing about white pastors being unusually law-abiding folks, we don’t have to guess about immigrants. There are plenty of large-scale studies. Here are a few summaries: (1) “Although there are always individual exceptions, the literature demonstrates that immigrants commit fewer crimes, on average, than native-born Americans.” (2) “Studies find that first-generation immigrants invariably engage in less violent crime than the native born.” (3) “With few exceptions, immigrants are less crime prone than natives or have no effect on crime rates.

Having more immigrants around means there are more humans around (and, indeed, more men), so, yes, there will be murderous anecdotes. It’s true with white pastors; it’s true with immigrants.

You can find anecdotes for pretty much anything. But when people want to draw general conclusions, that’s when we need good research on large samples.

Five Americas

A lot is made of regional divides. Urban vs. rural. Interior vs. coasts. North vs. South.

Yet, when I look at political data, these regional divides are rarely where the serious action is. Instead, the big political divisions involve factors such as race, religion, education, income, and gender. Once these kinds of basic demographics are taken into account, there may still be some additional differences based on living in a city or living in the South or whatever, but typically not very large ones.

This isn’t to say that regional differences are trivial. It’s just to say that most of the political differences between different U.S. places are a function of more basic demographics. And, indeed, there are enormous demographic differences between different places within the U.S.

Most people have a broad sense of some of these differences, but I wanted to take a more systematic look. So I used my large file of Pew datasets from 2013 to 2016—containing over 97,000 individuals—and had a go at it. In short, I loaded in, for each state: urban/rural proportion; the basic racial composition of its urban, suburban, and rural areas (white vs. black vs. Hispanic/Asian/other); the basic religious composition of white folks in its urban, suburban, and rural areas (not Christian vs. non-evangelical Christian vs. evangelical, which I define to include Mormons); and the percentage of white folks who have 4-year college degrees in its urban, suburban, and rural areas. I then did a cluster analysis on the states and was most happy with the one that produced five groups.

Keep in mind that, in lumping the states into coherent clusters, I didn’t tell my stats program where the states are; I just told it what sorts of folks are in those states. Nonetheless, there was a good deal of recognizable regional clustering—no surprise, it turns out that lots of neighboring states are demographically similar to one another. But there were also a couple of non-contiguous groups.

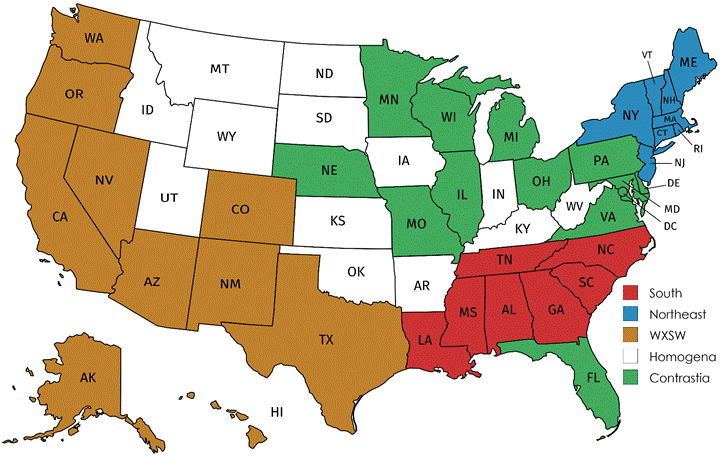
The map below shows the five clusters. You can see various southern states grouped together (shaded red), various northeastern states grouped together (shaded blue), and various western and southwestern states grouped together (shaded brown). These were easy enough to name: South, Northeast, and WXSW (that is, West by Southwest). But the other two groups are messier. These, for reasons I’ll explain below, I named Homogena (shaded white) and Contrastia (shaded green).

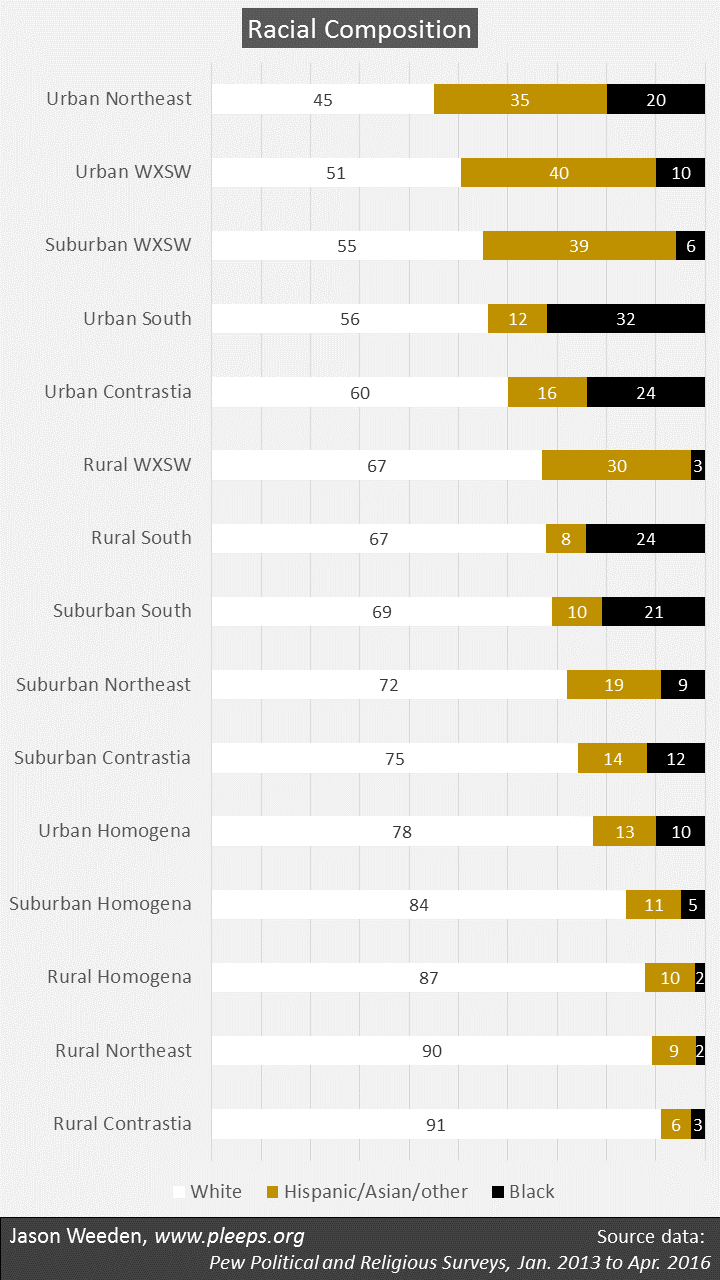
In general, the South and WXSW groups stand out for their racial diversity, the former containing relatively high numbers of blacks and the latter containing relatively high numbers of Hispanics/Asians/others. Lots of urban areas outside of these states also have high racial diversity, but these two groups have pretty high numbers of non-whites in their suburban and rural areas as well.

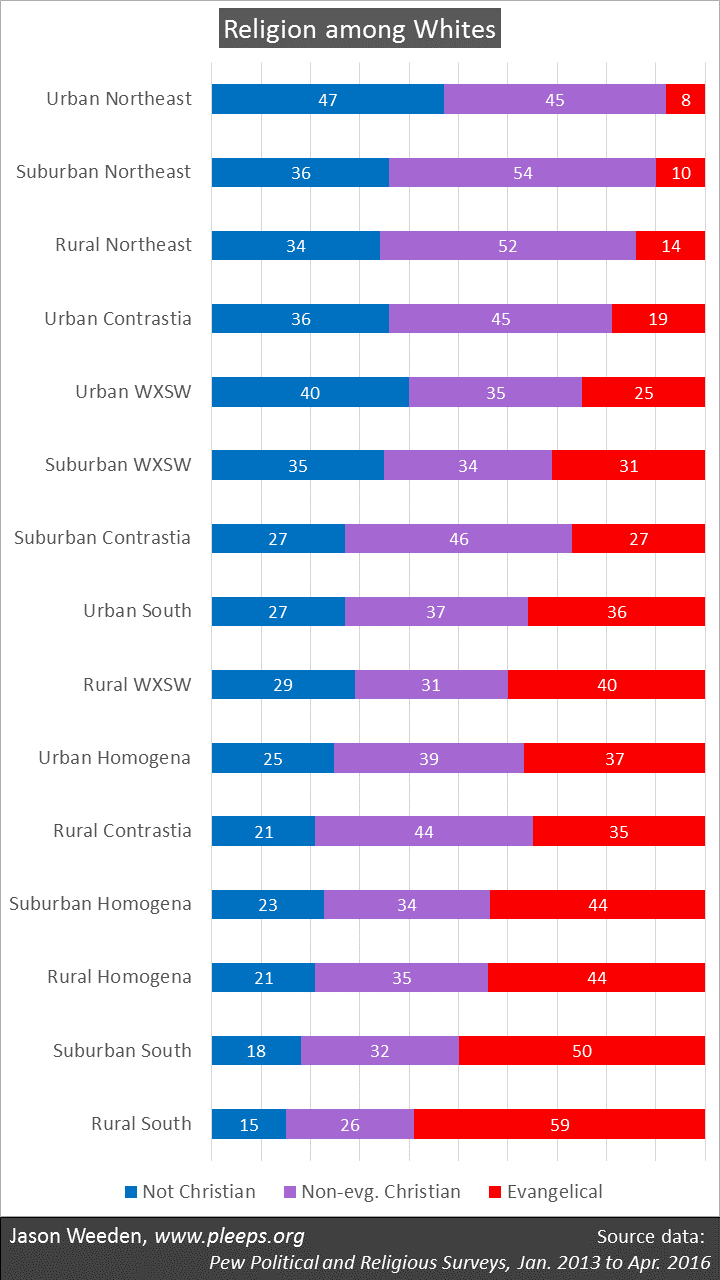
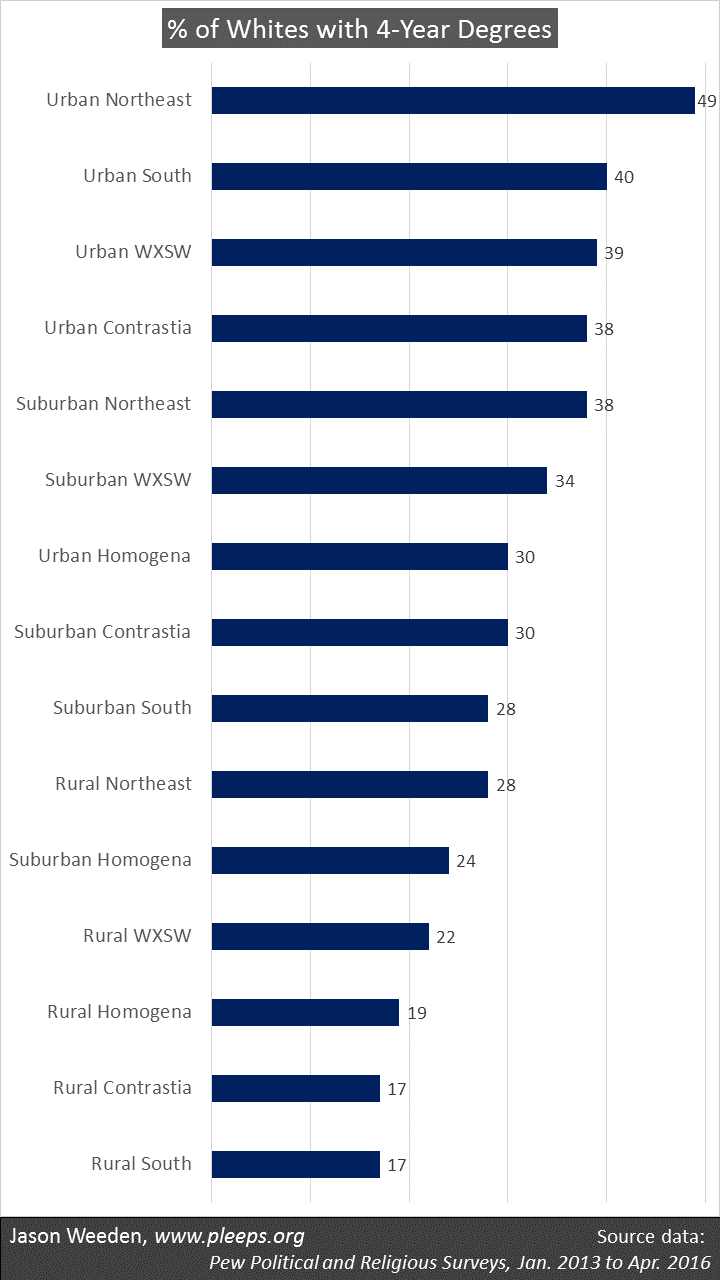
The stand-out feature of the Northeast group is primarily that its white population is less Christian and particularly less evangelical. In addition, its white population contains a higher percentage of college graduates. Like racial diversity, these features—having less-religious and better-educated whites—are common in lots of urban areas. But in the Northeast states this is also true of their suburban and rural populations.

The group I’ve labelled Homogena is, well, homogenous. This is a cluster that is largely white, and where whites are relatively more religious and less educated. This is true of lots of rural areas—whiter, more religious, less educated—but in these Homogena states it’s also true of their suburban and urban areas.

And, lastly, the group I’ve labelled Contrastia has a big contrast between urban and rural areas. Its urban areas look a lot like those in WXSW—racially diverse and with less-religious and better-educated whites. But its rural areas look like Homogena—lots of whites, most of whom are more religious and less educated. (Think, e.g., of the old quip about how Pennsylvania is Philadelphia in the east, Pittsburgh in the west, and Alabama in between.)

And then, of course, there are differences in the relative sizes of urban and rural populations across these state groups. Homogena is the most rural—according to Pew’s categories, there are around 1.35 rural folks for every urbanite. The South group is balanced at 1 to 1. Contrastia has almost 2 urbanites for every rural resident. And in both the Northeast and WXSW, urban dwellers far outnumber rural folks (at 3.5 to 1 and 4.7 to 1, respectively).

I’ll show some details. The first chart below gives racial percentages. Two big themes are apparent. First, urban areas tend to be more racially diverse than rural areas. And, second, the South and WXSW regions are more racially diverse while Homogena is particularly white—indeed, urban Homogena has a higher percentage of whites (78%) than rural South and WXSW (both at 67%).

The next chart shows white religious percentages. I’m focusing here on whites because whites show by far the biggest political differences as a function of religion (see, e.g., here). The primary religious divisions among whites are non-Christians vs. non-evangelical Christians vs. evangelicals, so that’s what the chart shows. Again, there are two big trends. First, whites tend to be less Christian and less evangelical in urban areas than in rural areas. Second, whites in the Northeast group are just a lot less Christian/evangelical than whites in the South and Homogena groups—so, for example, whites in rural Northeast are substantially less Christian/evangelical than whites in urban South and urban Homogena.

The last chart shows the percentage of whites who have 4-year college degrees. Again, I’m limiting this to whites because of education’s particular political salience for whites (e.g., the great widening of the degreed vs. non-degreed split among whites was the Big Thing in the 2016 election, showing up in both the exit polls and in stave-level shifts). And, once again, we see an urban-rural theme and a state-group theme. Urban whites are substantially more likely to have college degrees than rural whites. And then the Northeast group of states has particularly high white education levels, such that whites in the suburbs there look more like other places’ urban whites, while whites in rural Northeast look more like other places’ suburban whites.

So, you can see how the basic demographics of different places account for most of their largescale political differences these days. Democrats tend to do especially well in cities, the West Coast, and the Northeast (and these categories, as I mentioned, are themselves related, because the West Coast and the Northeast contain far more urbanites than rural folks). These are places that have various combinations of more racial minorities along with less-religious and better-educated whites. Republicans tend to do especially well in rural areas, central states, and the South (which, again, are related categories). These are places with various combinations of more whites and/or more-religious and less-educated whites. In short, for example, the political differences in party affiliation or on racial issues between white evangelicals, on the one hand, and minorities and college-educated white non-Christians, on the other hand, are very substantial pretty much everywhere you look. But the political differences within white evangelicals (or within blacks, or within college-educated white non-Christians, etc.) tend not to be all that large from place to place, though there are some differences at the margins.

All this relates to the parties’ current national consistency, something that certainly wasn’t always the case. A half century ago, there were markedly different kinds of Democrats and markedly different kinds of Republicans from region to region. But over the past few decades the parties have become thoroughly sorted and polarized on a range of issue positions. This has led to bigger splits on the basic demographics (race, religion, education, etc.) that relate to these issue opinions, and thus to regional differences driven primarily by these demographics.

Economic issues vs. lifestyle issues

In our current sorted and polarized age, it’s tempting to slip into one-dimensional thinking when it comes to issue opinions. Most people, it can seem, are either liberals/Democrats, moderates/independents, or conservatives/Republicans, all lining up neatly on a single left-to-right axis. It’s become such an ingrained notion that lots of political psychologists see their primary job not as explaining the sources of particular issue opinions, but rather the sources of generalized liberal and conservative orientations—orientations they suppose might arise from basic personality features, or moral foundations, or negativity bias, or whatever.

And then, if you hang out in certain circles, you might add an exception to the general one-dimensional rule for libertarians. These are folks who are conservative on economics but liberal on many social issues. So that’s apparently the world we live in: Lots of liberals, moderates, and conservatives, plus some libertarians.

Given the pervasiveness of this kind of framework, the actual patterns of public opinion become a bit surprising. The most potent contrast is between rich-poor redistributive economic issues on the one hand and religious lifestyle issues (abortion, gay rights, marijuana legalization, and so on) on the other. These are both central matters in modern political fights, but their relationship in the general public is complex.

As Kurzban and I reported using U.S. General Social Survey data, positions on economic issues and on religious issues were essentially uncorrelated as recently as the 1980s, though they’ve become increasingly correlated over the years since. What this tells you is that liberal-conservative alignment in these areas isn’t the product of some deep or ancient feature of human nature, but instead is the product of some contingent, recently arisen factor. It’s not hard to guess what that factor might be. Starting in the late 1970s and accelerating through subsequent years, the U.S. political parties increasingly came to align economic conservatives and religious conservatives against economic progressives and secular liberals. The recent correlation between economic opinions and religious opinions has plausibly arisen primarily as a result of contingent coalitional psychology.

And we further found that the new correlation between economic and religious opinions is not uniformly distributed in the population. In particular, college-educated whites have become uniquely likely in recent years to bring their economic and religious issue opinions into left-right alignment, while for the remaining (large majority) of the population, ideological alignment on these issues has remained much lower.

Now, this has all had a further effect that undermines the typical story about how people mostly divide into liberals and conservatives and libertarians. This gets a little complicated, but it’s an important point. Think of the 4 quadrants when simultaneously considering economic and religious issue opinions. There are liberals (liberal on both) and conservatives (conservative on both), and there are also libertarians (conservative on economics but liberal on religious lifestyle issues) and communitarians (liberal on economics but conservative on lifestyles). One way to think about what it means to say that economic and religious opinions used to be uncorrelated is just this: it used to be the case that the combined number of liberals and conservatives was about equal to the combined number of libertarians and communitarians.

These days they’ve become more highly correlated. What this means is that the number of liberals and conservatives has increased relative to the number of libertarians and communitarians. But we also know that it’s mostly college-educated whites who have abandoned libertarian/communitarian positions in favor of liberal/conservative ones. And here’s the thing. Libertarianism is most prevalent among less-religious, wealthier whites. Communitarianism is far more common among religious, lower-income racial minorities.

So the abandonment of libertarian/communitarian positions has happened mostly among college-educated whites, who are far more likely to be libertarian than communitarian. Indeed, in a past post I showed how there’s been an utterly remarkable transformation since the 1970s in the economic opinions of wealthier white non-Christians. Despite their longstanding social liberalism, these folks used to be as economically conservative as wealthier white Christians. And now they’ve just completely switched sides on economics on average. Indeed, what should have been an increasingly favorable demographic environment for libertarianism over the past few decades has instead actually seen a relative decline in folks with libertarian opinion combinations.

The “relative” qualifier here is important. Public opinion generally has shifted quite dramatically to the left on gay rights and marijuana legalization (though not on abortion). So in that sense there are more liberals and libertarians these days relative to conservatives and communitarians. But, as the lifestyle baseline has moved, we’ve also seen a relative shift toward liberals and conservatives and away from libertarians and communitarians.

But there remain, in fact, quite a few communitarians in the general public. It’s just that they’re not prevalent among the people researchers normally hang out with, nor among the folks you’d usually pick up in either a college-student sample or an internet volunteer sample.

So let’s take a look at some recent data. Here, using my aggregate file of Pew surveys from 2013 to 2016, I used demographic information to find various splits in views on rich-poor economic issues and religious lifestyle issues. (The economic opinion measure is the one I described here, and the lifestyle opinion measure is the one I described here.)

I ended up with over 20 separate groups; the chart below shows the 12 groups with the most liberal and most conservative views on economic issues and lifestyle issues. Groups that tend to be liberal on both are toward the upper-left blue corner. Groups that tend to be conservative on both are toward the lower-right red corner. The communitarian groups (i.e., liberal on economics and conservative on lifestyles) are toward the upper-right corner. The libertarian groups (i.e., conservative on economics and liberal on lifestyles) are toward the lower-left corner.

Notice that there really aren’t any solidly libertarian demographic groups these days. This isn’t to say that there aren’t solidly libertarian individuals; of course there are. But while, say, group 4—these are non-Christian white men with college degrees—would have been squarely in the libertarian corner 30 or 40 years ago, they’ve now become left of center on economics.

But there still exist predominately communitarian groups, including non-evangelical Christian immigrants with lower incomes (group 5, who are mostly Hispanic Catholics), black evangelicals (group 6), and Hispanic/Asian/other evangelicals (group 7). (Not coincidentally, these are among the folks that epistocracy proposals tend to hammer hardest, as libertarians seek to make the voting public more libertarian on average by diminishing Democratic communitarian representation.) Unlike college-educated whites, these are largely folks who simply haven’t brought their views in different opinion domains into widespread ideological alignment.

Whenever you hear about how general forces of human psychology inherently push people into being liberals and conservatives (and in exceptional circumstances libertarians), you should imagine this enormous segment of the public giving a polite *ahem*.


White nationalism vs. lifestyle issues

Often you’ll see political researchers and commentators divide the issue landscape into “economic” issues on the one hand and “social” or “cultural” issues on the other. However, this isn’t a great way to think about things, mainly because there’s only a loose relationship among many of the social/cultural issues.

The primary divide within social/cultural issues is between those that relate strongly to race and those that relate strongly to church attendance. Examples of the former are items such as affirmative action, immigration, the death penalty, and gun control. Examples of the latter are items such as abortion, same-sex marriage, marijuana legalization, as well as views on premarital sex, having kids outside of marriage, and pornography.

These are all issues one typically has in mind when talking about social/cultural issues, but in fact racial items are often not very strongly correlated with lifestyle items. There are plenty of folks with liberal racial views but conservative lifestyle views, and vice versa. Further, various racial issues actually correlate pretty strongly with opinions on redistributive economics whereas lifestyle issues typically have more modest correlations with economic issues.

For the analysis in this post, I combined a bunch of racial items into a single white nationalism measure (it’s the same one I used in a previous post on white nationalism vs. economic conservatism, which is mostly about immigration, but also has items on blacks, guns, and Middle Eastern conflicts) and also combined a bunch of church-correlated items into a single lifestyle issues measure (these were items on homosexuality, abortion, marijuana legalization, and having children outside of marriage; I give further details at the bottom of this post). I then started splitting the sample based on the biggest demographic predictors of these two measures, ending up with over 20 distinct demographic groups.

The chart below shows the 12 groups with the most liberal and most conservative averages on white nationalism and/or lifestyle issues. Some are pretty conservative on both—mainly groups with white evangelicals who are older and/or regularly churchgoing (i.e., those in the lower-right red corner). Some groups are pretty liberal on both—mainly groups that have some combination of being less religious, more educated, and/or younger (i.e., those in the upper-left blue corner).

(Note: “Evangelical” means non-Catholic Christians who either self-identify as “born again or evangelical” or are Mormon. “White” means non-Hispanic white.)

But there are also groups with pretty substantial gaps between their white nationalism positions and their lifestyle issues positions. The key one is group 7 (i.e., evangelicals who are non-white immigrants). On average, they’re rather liberal on white nationalism but also rather conservative on lifestyle issues. Turns out that not that many immigrants think immigrants are threatening, and not that many self-described evangelicals are pro-gay, pro-choice, and so on. Other groups that skew in this direction include group 6 (i.e., immigrants who are younger non-evangelical Christians), who tend to be liberal on white nationalism but centrist on lifestyle issues, and group 11 (i.e., white evangelicals who are churchgoing and young), who tend to be conservative on lifestyle issues but just right of center on white nationalism.

On the other side are groups that are more conservative on white nationalism than on lifestyle issues. These include group 8 (i.e., white non-evangelical Christians who are younger, don’t attend church regularly, and don’t have 4-year degrees), who tend to be pretty conservative on white nationalism but centrist on lifestyle issues. It also includes groups 2 (i.e., atheists and agnostics without 4-year degrees) and 4 (i.e., other non-Christians without 4-year degrees who are white and young), both containing folks who are on average very liberal on lifestyle issues but not as liberal on white nationalism.

Taking a broader view, here’s what we’re looking at. With all political issues these days, there are pervasive themes and varying domain-specific themes. The pervasive themes are the liberalism of non-Christians (particularly when college-educated) and the conservatism of white evangelicals (particularly when not poor). These patterns will show up in pretty much any widely debated partisan issue these days.

But there are also domain-specific themes. On economic issues, wealthier whites are more conservative and poorer minorities are more liberal. On white nationalism, low-education whites are more conservative and the various targets of white nationalism—immigrants, blacks, Muslims, and so on—are more liberal (especially on issues specifically impacting themselves, e.g., blacks on racial issues, immigrants on immigration issues, etc.). On lifestyle issues, low-education churchgoers are more conservative and high-education secular folks are more liberal. Sometimes these domain-specific themes create interesting ideological divergence.

Some details on sample and measures

I’m working off my recently updated aggregate Pew file that I described in a prior post. The white nationalism measure is the same one I described in that post, combining 58 individual survey questions (mostly on immigration, but also items on race, gun control, and military/Middle East/Muslims).

The lifestyle measure combines 27 items, of which over 74,000 respondents were asked at least one. The main items include: whether homosexuality should be accepted or discouraged, whether same-sex marriage should be allowed, whether abortion should be legal or illegal in all or most cases, whether more people having kids without getting married is a change for the better or the worse, whether society is better off if people make marriage and having kids a priority, whether pot should be legal, and so on.

OK, so I’ve compared white nationalism with economic issues in my prior post and white nationalism with lifestyle issues in this post. I’ve got one more to go—comparing economic issues with lifestyle issues.

White nationalism vs. economic conservatism

One of the key things to watch over the next months and years is how Republicans advance the Bannon/Trump white nationalist agenda alongside the usual Republican economic agenda. Any sense that white nationalism was a mere election tool that would remain ultimately neglected in policymaking is being shaken by recent events; and while some congressional Republicans have raised objections, it doesn’t seem to be at a level that’s likely to translate into actual attempts to restrain the White House’s plans. Similarly, it’s still an open question whether the occasional elements of economic populism in Trump’s campaign will actually translate into White House resistance to congressional plans to combine large tax cuts for the wealthy with benefit cuts for poorer folks and seniors.

In this post, I’ll take a look at the demographics of views on white nationalist issues (immigration, race, Muslims, etc.) compared with views on rich/poor economics (government aid to the poor, the role of corporations and Wall Street, etc.). Which demographic groups are relatively aligned such that they tend to have consistently liberal or moderate or conservative views on both sets of issues on average? Which demographic groups are more likely to diverge such that they tend to hold views on one set that are to the left or right of their views on the other set?

This tells us something about the voters who might find different balances between white nationalism and economic conservatism either appealing or disappointing. Which in turn tells us something about how the parties in future elections might deal with different demographic slices.

I’ll give further details down below, but the short version is that I combined a large number of Pew datasets and created a couple of opinion mega-items, one of which combined lots of questions about immigration, race, Muslims, the Middle East, the military, and guns, and the other of which combined lots of items about government benefits, the poor, corporations, Social Security, and so on. I then took a set of demographic items (race, religion, gender, education, income, etc.) and began dividing and subdividing the sample, stopping when I reached 24 groups.

I’ve split the results into two charts to make the main point easier to spot. The first chart includes the 12 groups whose views on white nationalism and redistributive economics are in closest ideological alignment—that is, their liberalism or conservatism on one (on average, relative to the population as a whole) roughly matches their liberalism or conservatism on the other (again, on average, relative to the population as a whole). So, for example, group 1—non-white immigrants who’ve never been to college—are, on average, quite liberal on white nationalism and quite liberal on economic opinions. And group 12—white evangelical men without 4-year degrees and with household incomes above $40k—are quite conservative on both on average.
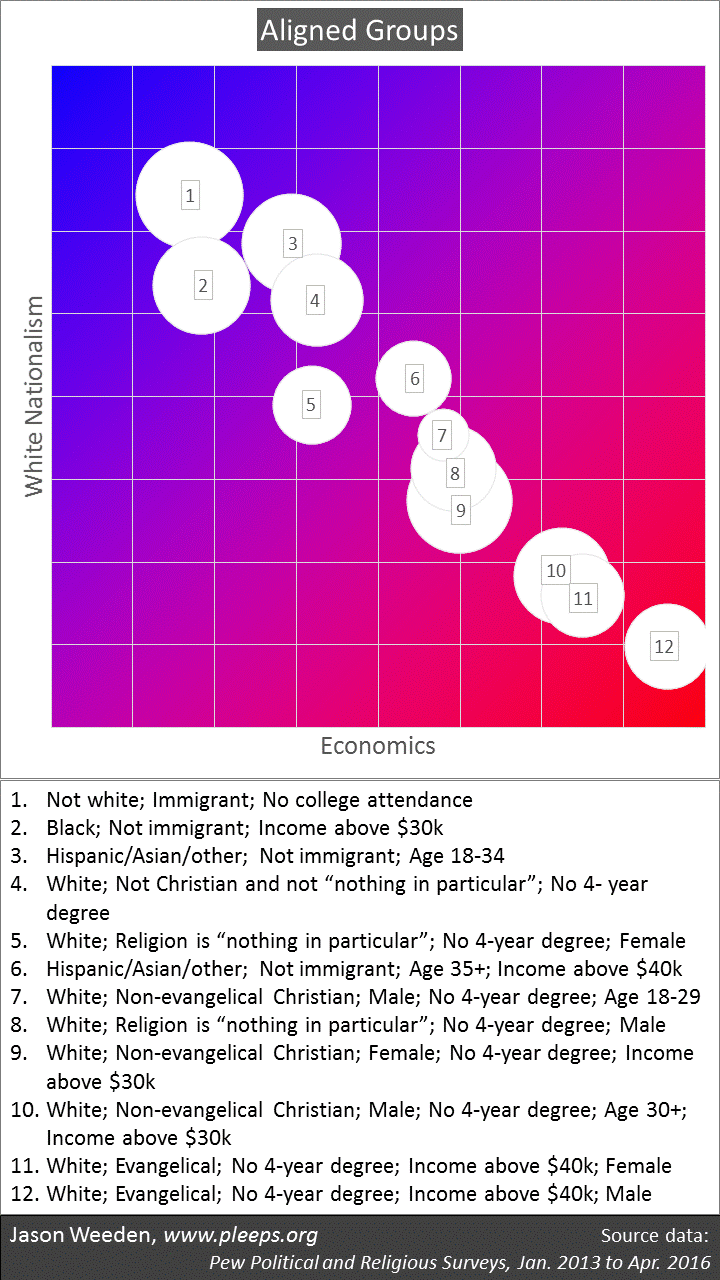
So those are the 12 groups that are most aligned. Now we get to the more interesting ones, the 12 groups that are most divergent. The chart above was pretty straightforward—the groups ran from most liberal in the upper-left corner to most conservative in the lower-right corner. The chart below is more complex because, for these divergent groups, now you’ve got to think about what it means to trend towards the upper-right corner and the lower-left corner. Because white nationalism runs from liberals at the top to conservatives at the bottom while economics runs from liberals on the left to conservatives on the right, the upper-right corner would hold a group that is liberal on white nationalism but conservative on economics (i.e., a kind of multiculturalist libertarianism) while the lower-left corner would hold a group that is conservative on white nationalism but liberal on economics (i.e., a kind of white nationalist populism).

As you can see in the chart below, these 12 divergent groups form two lines. One line (groups 1 through 6 on the chart below) includes groups that tend to be more conservative (or less liberal) on white nationalism than on economics. These are mostly groups that have less education and less income. The other line (groups 7 through 12 on the chart below) includes groups that tend to be more conservative (or less liberal) on economics than on white nationalism. These are mostly groups with college graduates.
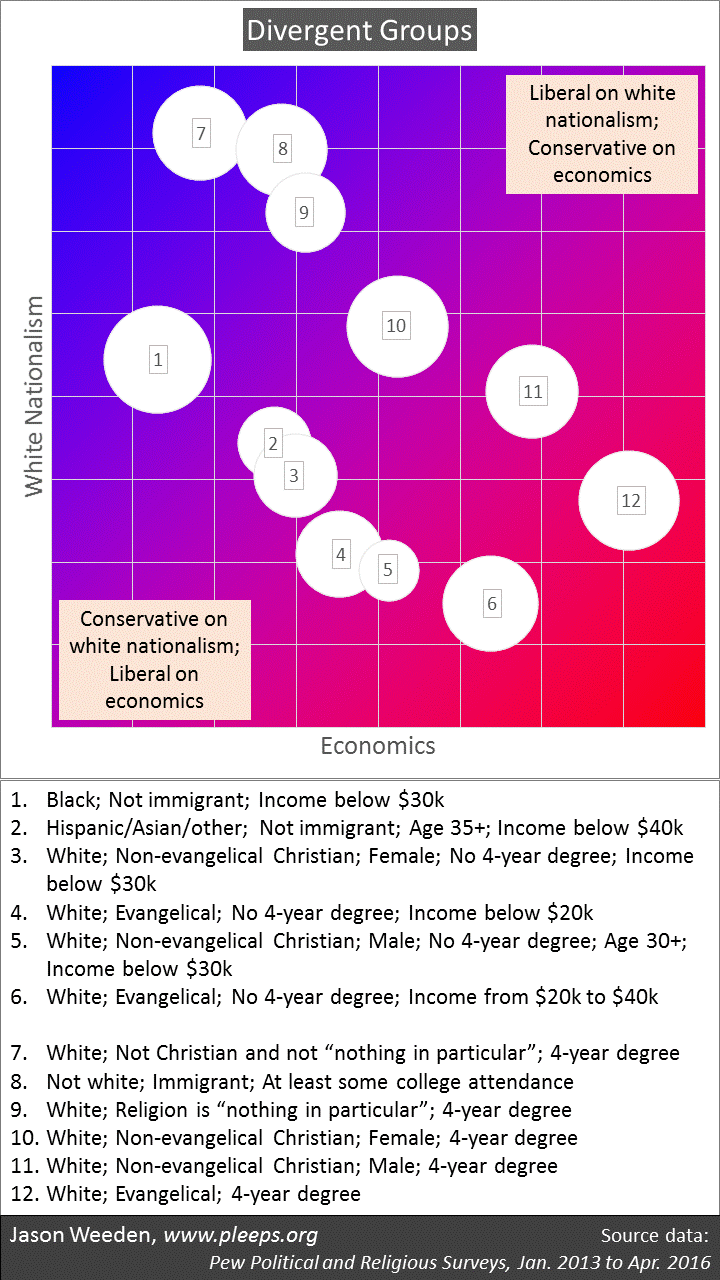
Here’s how to think about it. For these two opinion domains, race and religion operate as powerful drivers of liberal-conservative alignment. The conservatives tend to be white evangelicals and, to a lesser extent, white non-evangelical Christian men. White non-evangelical Christian women tend to be in the middle. And the liberals tend to be either white non-Christians or non-whites.

But then layered onto those powerful trends are the roles of education and income, which cause ideological divergence rather than ideological alignment. College-educated folks tend to be more liberal on white nationalism than on economics; poor folks tend to be more liberal on economics than on white nationalism.

These two patterns—the left-right ideological role of race and religion, and the divergence-driving role of socioeconomic status—combine to create the patterns in relative support for white nationalism and economic conservatism. For example, white evangelicals tend to be quite conservative on the whole. But, in addition, white evangelicals with 4-year degrees tend to be significantly more conservative on economics than on white nationalism, while white evangelicals who are poor tend to be significantly more conservative on white nationalism than on economics. (And, as shown on the first chart, the white evangelicals who tend to be about equally conservative on both are those who don’t have 4-year degrees, but who also aren’t poor.)

Other patterns are similar. Blacks who aren’t poor are liberal on both opinion domains, but poor blacks are significantly more liberal on economics than on white nationalism (e.g., they’re less supportive of immigration). Or, while white non-Christians without 4-year degrees tend to be on average roughly equivalently center-left on white nationalism and economics, degreed white non-Christians are significantly more liberal on white nationalism than on economics.

Electioneering

There’s already been a lot of early advice on how Democrats should make demographic adjustments to improve their performance in future elections. Much of this advice has encouraged Democrats to reconnect with low-education and low-income whites through an emphasis on economic populism and a de-emphasis on multiculturalism.

But the answer will depend to a degree on how Republicans manage to balance white nationalism against economic conservatism. If Republicans neglect white nationalism and instead focus on economic changes—cutting taxes for the wealthy, substantially diminishing ACA subsidies, making long-term cuts to elderly entitlements, and so on—then the downscale white strategy probably would make the most sense.

On the other hand, if Bannon/Trump manage to make policy changes that lean heavily towards white nationalism but not economic conservatism—banning Muslims, deporting DREAMers, building the wall, and so on, but not doing much to diminish current safety net programs—then the best new Democratic opportunities might come from college-educated whites.

The operative assumption has been that of course they’re going to pay lip-service to white nationalism while implementing substantially regressive economic changes. But the early days of the new Republican order have made this assumption less obvious. We’ll have to wait and see.

Some details on sample and measures

The sample I used for these analyses combines the 2014 Pew Religious Landscape sample with all publicly available Pew political samples from the beginning of 2013 to the most recently released. The aggregate sample is almost 98,000 folks (sweet!). Because not all opinion items were asked to all respondents, I combined whichever were available for a given respondent. Around 90,000 were asked at least one relevant white nationalist item and around 74,000 were asked at least one relevant economic opinion item. So, even when splitting up the sample into the 24 groups that I did, each group is still awfully big (around 1,500 to 5,000 each—super sweet!). I love Pew.

The white nationalism measure combines responses on 58 items. The main items (i.e., those asked to the most people in the sample) include: whether the growing population of immigrants is a change for the better or for the worse, whether immigrants strengthen the country, whether peace is best kept through military strength or diplomacy, whether undocumented immigrants should be allowed to stay in the country, whether racial discrimination is the main reason why many blacks can’t get ahead, whether overwhelming force is the best way to defeat terrorism, whether immigrants threaten American values, whether the country needs to continue making changes to give blacks equal rights, whether gun control is important, whether Islam encourages violence more than other religions, and so on.

The economic measure combines 29 items. The main ones include: whether government aid to the poor does more harm or more good, whether a smaller government with fewer services would be preferable, whether corporations make too much profit, whether poor people have easy or hard lives, whether the government should do more to help the needy, whether Wall Street helps or hurts the economy, whether the government should play a major role in helping people get out of poverty, whether the government should be responsible for making sure people have health care, whether Social Security benefits should be reduced, whether people are poor because of lack of effort, and so on.

So this was fun for me. I’ll keep going with similar analyses. Next up: Comparing views on white nationalism with views on lifestyle issues (same-sex marriage, abortion, marijuana legalization, etc.).