
The fine folks at the Pew Research Center have been posting their data online. For anybody. For free. Holy schnikes. For people like me who used to sit around waiting for a couple thousand new General Social Survey (GSS) respondents every two years, it’s stunning. I downloaded all the Pew political surveys just from January 2013 to January 2016 (the latest available), and it totals 58,551 respondents. This 3-year batch from Pew is basically the same size as the entire 43-year GSS dataset. I would try to put into words how I feel about samples this large, but I would collapse into joyful blubbering.
So now I’m playing with that data. For this post, I’ll look at how demographics (race, religion, etc.) predict the 10-item Pew Ideological Consistency Scale. Recently, they asked the full scale to around 10,000 people in 2014 and to another roughly 6,000 people in 2015. (Bring on the joyful blubbering.)
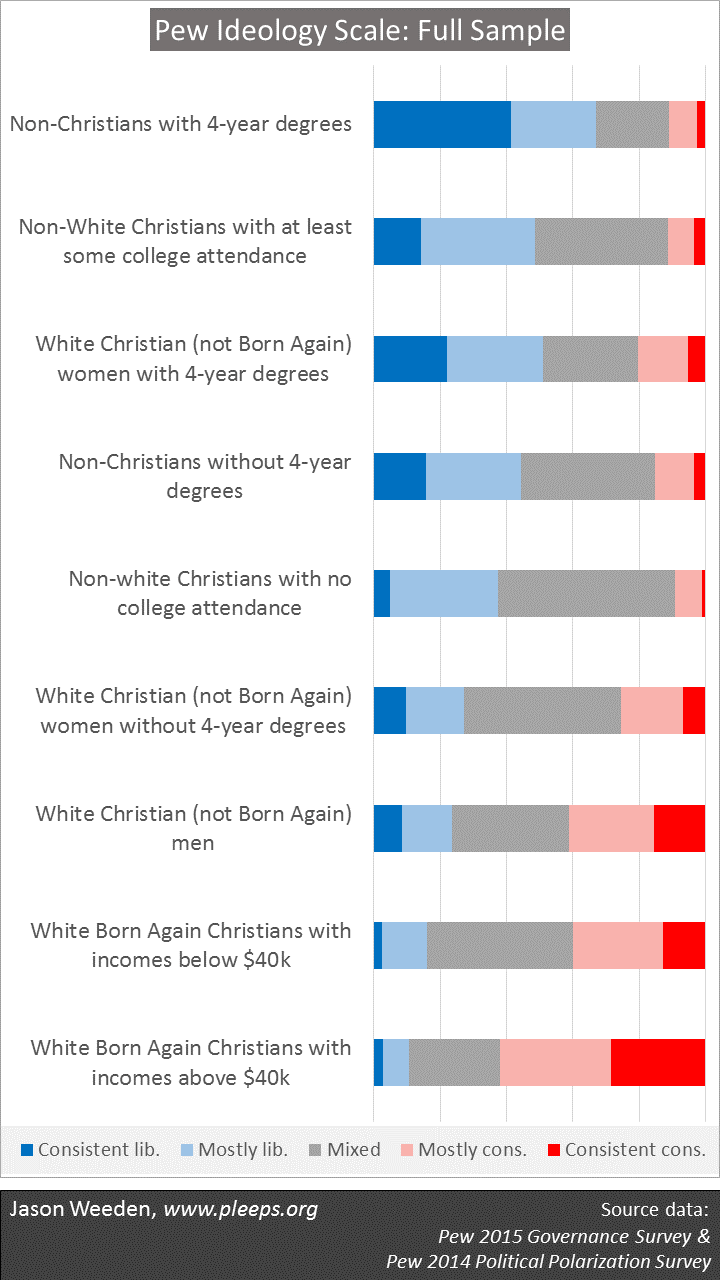
I’ll explain everything below, but for those impatient to see the results, here they are:
 (A few terminological notes. By “white” I mean non-Hispanic white. “Born Again” means the respondents described themselves as either (1) “born again or evangelical Christian” or (2) Mormon. “Non-Christian” includes everything not expressly Christian (Jewish, Buddhist, “Nothing in particular,” etc.). “Income” is total family income in the prior year. I’m using Pew’s definitions of “consistent,” “mostly,” and “mixed” in the ideological categories.)
The Pew ideology scale is pretty good as a measure of overall issue-oriented left-right position. There are big-government items, rich-poor items, and single items on race, immigration, military force, the environment, and homosexuality (here’s a link to the exact questions). Its main weakness is that it’s light on items that correlate strongly with church attendance (e.g., abortion, marijuana, premarital sex)—it includes only one (on homosexuality). When people label themselves as “liberal” or “conservative,” it’s often as much about these lifestyle/church items as anything else. (A tell-tale sign here is that if you predict self-labelled ideology in the Pew data using the issue-based ideology scale as a predictor, there’s still a nice-sized chunk of variance left over for church attendance.) But, like I said, it’s a pretty good measure on the whole.
Here, I took the 10-item Pew ideology scale and started predicting it based on a large set of available demographic items (actually, I was predicting two things: left-right positions and consistent-inconsistent positions). Basically, it’s: Find the biggest predictor and split the sample on that predictor; now find the biggest predictor in each of those two sub-groups and split again; keep going with the biggest predictors in the biggest sub-groups until you’ve got an interesting number of sub-groups.
The chart above shows nine major demographic sub-groups when it comes to the Pew ideology scale. The sub-groups are mutually exclusive and encompass the entire sample. For those who’ve read The Hidden Agenda of the Political Mind, three of the key themes driving these results will be familiar: The biggest current demographic deals in American politics are race and religion; the overwhelming majority of folks mix-and-match conservative and liberal positions on particular issues; and college-educated whites have become especially likely to align their particular positions on a single left-right axis (though plenty still mix-and-match).
The chart is ordered from the most liberal demographic group up top to the most conservative group at the bottom. So, for example—based just on a mechanical, algorithmic splitting of the sample—the most liberal three groups match the demographic profiles of Bernie Sanders, Barack Obama, and Hillary Clinton, respectively. In general, the most liberal profiles tend to come from college-educated folks who might reasonably worry about traditional discrimination (because of, for example, religion, race, or gender). The conservative side is mostly white Christians, especially when Born Again, non-poor, and/or male. These are people who tend to benefit from the current conservative alignment of pro-discrimination, pro-wealth, and restrictive lifestyle policy positions.
While left-right clumping is interesting, deeper insights come at the level of particular issues. For example, if you want to know why lower-income white Born Again Christians are less likely to be consistently conservative on Pew’s scale than higher-income ones, it’s largely because the poorer ones are more likely to have liberal responses specifically on economic items (e.g., involving government support for the poor).
I’ll probably do a number of posts using Pew data, mostly focused on how particular issue positions relate to demographics. There are several really good issue items scattered throughout the surveys. On demographics, the Pew data lack the GSS’s super-cool life-history information (number of past sex partners, number of children, history of divorce, etc.), but have significant strengths as well (including good religion measures).
[Update: Here’s a guide to other recent posts of mine, many on political demographics.]