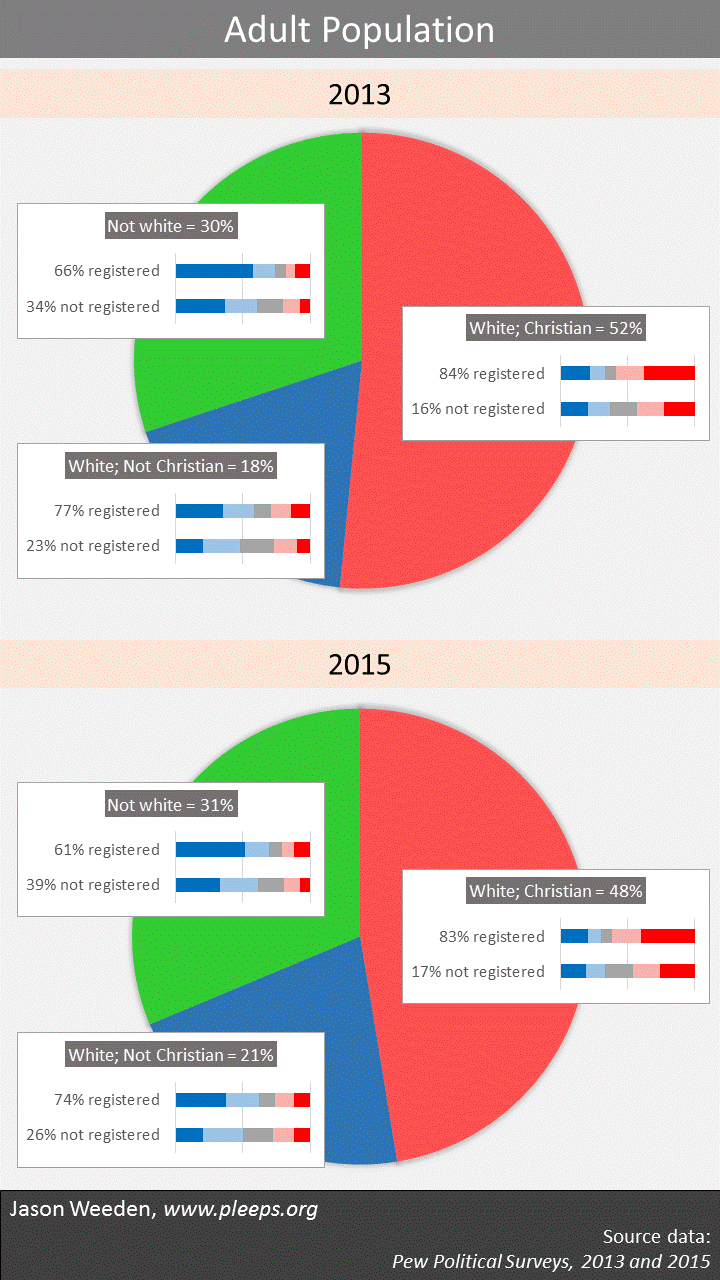
The U.S. has passed a major milestone in political demographics. At probably every point in its history, a majority of resident adults were white Christians. But around 2014 that changed.
The relative decline of white Christians comes from two sources—the increasing non-white population and the decreasing proportion of whites who are Christian. In the past few years, in fact, net migration has slowed, making the primary driver of the trend the rapid rise of non-Christian whites. The chart below is based on Pew political surveys from 2013 and 2015. In just this 2-year period, white Christians declined from 52% to 48% of the adult resident population. And while the non-white percentage increased a small amount from around 30% to 31%, the percentage of white non-Christians increased substantially from 18% to 21%.
 (Technical notes: The number of respondents was 14,104 in 2013 and 17,518 in 2015. Results are weighted. “White” means non-Hispanic white and includes some individuals with missing information and mixed white/native background. The “registered” and “non-registered” percentages are estimates based on responses to Pew’s registration item; the accompanying bars are weighted party identification totals—Democrat, independent leaning Democrat, independent with no lean, independent leaning Republican, and Republican.)
White Christians retain their registration majority, for now
While white Christians are no longer a majority of the resident adult population, they’re still a majority of those registered to vote. The chart shows estimates of the percentage registered for each group based on Pew’s self-report measure. When the math is worked out, while white Christians were 52% of the adult resident population in 2013, they were over 56% of those registered to vote; and while white Christians declined to only 48% of the population in 2015, their percentage of those registered dropped to only a bit under 54%.
White Christians maintained their registration advantage in a couple of ways. First, a substantially larger portion of whites are eligible to vote, both because relatively more Hispanics and Asians are non-citizen immigrants and because felon voting bans disproportionately affect blacks. Second, both non-white and non-Christian adults are substantially younger than white Christians on average—while the typical white Christian is 52, the typical non-white is 39 and the typical white non-Christian is 40. Indeed, part of the relative registration advantage of white non-Christians in 2015 stems from the fact the non-white and non-Christian registration rates declined substantially from 2013 to 2015 (which relates to the unusually low turnout in the 2014 midterms), yet the registration rate for white Christians remained almost as high in 2015 as it was in 2013.
Projecting forward, how do things look for this year’s election? As far as I can tell, white Christians might end up being about half of those registered later this year. This assumes that non-white and non-Christian registration rates go back up to their 2013 levels, and that white Christians continue their relative population decline at the same pace that we saw from 2013 to 2015—assumptions that may or may not hold.
The Democratic majority continues to emerge, but the patterns are always changing
The relative number of white Christian voters has been crucial in recent elections because they form the core of the Republican coalition. As shown in the chart, registered white Christians have a heavy tilt towards Republicans, registered white non-Christians have an equally heavy tilt towards Democrats, and registered non-whites favor Democrats enormously.
Assuming that the current patterns in partisan preferences continue, this suggests an emerging Democratic majority. The major caveat is that the non-white/non-Christian coalition has been far more likely to turn out in presidential than midterm elections. Also, of course, each election presents unique circumstances—for example, a financial crisis under a Republican president surely contributed to Obama’s large victory margin in 2008.
But can we assume that the current patterns in partisan preferences will continue? Probably not fully. Party coalitions are in constant flux, though at some times in quicker and more obvious ways than at other times. This year—with a particular contrast on issues of immigration, internationalism, and discrimination—we might see more college-educated whites heading away from Republicans as less-educated whites head towards it. This could weaken somewhat the religious divides within whites, as some college-educated Christians move to the left and some less-educated non-Christians move right. This would still predict an increasing Democratic majority on the whole, but one built on somewhat altered foundations.
A key unknown in all this is how voter participation patterns might change. As shown in the chart, non-registered folks tend to show more mixed partisan preferences than those in their demographic groups who are registered. This could be because political participation itself encourages side-taking; but it could also be in part because people with mixed liberal/conservative policy preferences are less likely to vote when given a choice between fully liberal and fully conservative candidates. If we move away somewhat from liberal vs. conservative parties and more towards minority/cosmopolitan vs. white nationalist parties, we should probably expect the current patterns of voter participation to evolve to some degree—those whose views are a better fit to the new alignment might increase their participation while those who find themselves newly politically homeless might become somewhat more likely to stay home on election day.
But then, of course, future elections will bring new coalitional pressures, as elections often do. Recent patterns give rise to a certain set of current expectations, but those patterns are constantly changing.
